

A Simplification of the Differences Between Specific and Global Risk
Understanding the Differences Between Specific and Global Risk is a complex topic.
For this article, we are going to explain the difference between specific and global risk without getting into too much detail.
In metrology, risk is a crucial factor influencing the decision-making process based on measurement results.
Two primary types of risk are considered in this context: specific risk and global risk.
Both types of risk are fundamentally different, and understanding these differences can help in making more accurate and reliable decisions.
Specific Risk
As the name suggests, specific risk is specific to a given test measurement result.
It is the probability that a test measurement result indicates a product is within specifications when it is actually outside specifications.
This is often called the Probability of False Accept (PFA) or False Accept Risk (FAR). The PFA is also known as Type II error or Consumers Risk.
The proper terminology is Conditional (Specific) False Accept Risk, often used when dealing with a specific instrument, typically a recalibration scenario.
This risk arises due to the inherent uncertainty in the test measurement.
Specific Risk or Bench Level risk can be calculated by integrating the Probability Density Function (PDF) of the test measurement uncertainty outside of the specification limits.
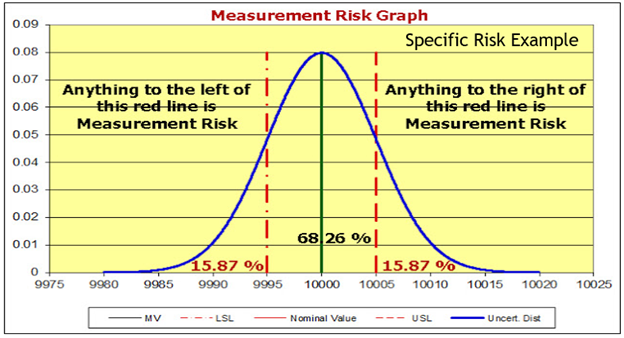
The specific risk is illustrated where the upper tail of the probability curve falls above the upper specification limit or the lower tail falls below the lower specification limit.
The area to the left and right of the specification limit shown using a dotted red line represents the probability (specific risk) of incorrectly accepting a product given this measurement result.
ASME B89.7.3.1-2001 has an excellent example of Specific Risk.
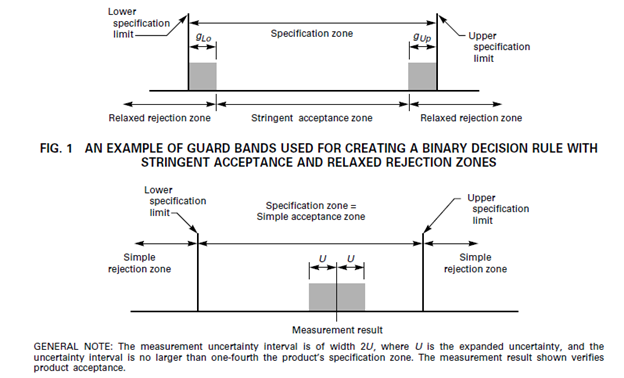
The ASME B89.7.3.1-2001 shows a Specific Risk example where a Guard Band is used (Often equal to the Expanded Measurement Uncertainty of the Calibration Process) to decrease the acceptance zone. When the measured value falls within the Stringent Acceptance Zone, it is said to be conforming to the specifications. If the measured value is anywhere outside of the stringent acceptance zone and in the relaxed rejection zone, a “Fail” would occur.
Note: Any representation with only one probability distribution is always a specific risk method.
Global Risk
On the other hand, when speaking of PFA, global risk uses the Unconditional Probability of False Acceptance (PFA), which is the probability that a test measurement on any population of products, if individually measured, would result in an incorrect pass determination.
Unlike specific risk, global risk considers the test measurement probability distribution and the probability of encountering a product at that measured value. This requires integrating the joint PDF of the test measurement and the PDF of the unit under test.
It's important to note that global risk cannot be calculated without specifying a distribution of values for the product obtained from a priori knowledge and measurements.
Often one might see reliability numbers such as 95 % EOPR with a 95 % Confidence Interval, which is the prior knowledge being discussed. In this case, the requirement would be to have at least 58 like calibrations where the measured values were within the tolerance limits.
There will be more future articles on calculating Reliability. If neither the EOPR nor a Test Uncertainty Ratio (TUR) threshold is met, one could choose to use Specific Risk methods or another method or decision rule.
The critical difference between specific and global risk lies in their scope and application. While specific risk is tied to a particular test measurement result, global risk is often a broader concept considering any test measurement on any product.
This means that while specific risk can be high for a particular measurement, the global risk may still be low if the overall product distribution is within the specification limits.
The type of risk one can accept is likely based on their risk tolerances. If the application is critical, one might choose a specific risk model versus a global one that primarily deals with the population of similar instruments.
An Example using both Specific and Global Risk.
A company has hired us to measure the speed of cars on a stretch of a single-lane road.
In discussing contract requirements with the customer, the customer wants the best economical solution to determine whether drivers are observing the appropriate speed limit.
The customer has indicated they are okay with 57 -63 miles per hour (MPH) speeds. Thus our specification limit is based on 60 MPH ± 3 MPH.
The posted speed limit is 60 MPH.
After much discussion, we decided to set up two radar guns at points A and B for the first day and report the results.
We have posted a large sign notifying drivers that their speed is being monitored.
On Day 1, we record about 10,000 vehicles. Out of the 10,000 vehicles, 9,800, or 98 %, are observed to be driving between 57 - 63 MPH.
The Calibration Process Uncertainty of this measurement is 0.5 MPH (TUR of 6:1). There is very little doubt in our ability to accept the results.
The results are reported to the customer, who is pleased with the results and ask if there is a way to reduce the costs of paying for two people with radar guns is expensive.
The solution is that instead of two manned vehicles with radar guns, we can use a system that monitors when a car crosses point A and then records the same car as it crosses point B.
The Specific Risk would be based on the measured speed at either point A or B.
When using both points and we generate an average, we would be using a global risk model.
We can also use a global risk model if we base the speed on the car's time from point A to Point B.
We can say the distance is one mile, and we will measure the time it takes. The speed limit on the stretch of road is 60 mph.
Thus, we expect it to take one minute.
The system is much less expensive and uses a time-based method, though the Calibration Process Uncertainty is now 1 MPH.
Everyone feels this new method is acceptable based on the 98 % observed tolerance probability using the radar guns and a TUR of approximately 3:1.
The average speed is then measured for weeks, and the values are deemed acceptable.
The customer then asks us to get a little more detail and agrees to have us install two radar guns and sample some vehicle speeds at points A and B.
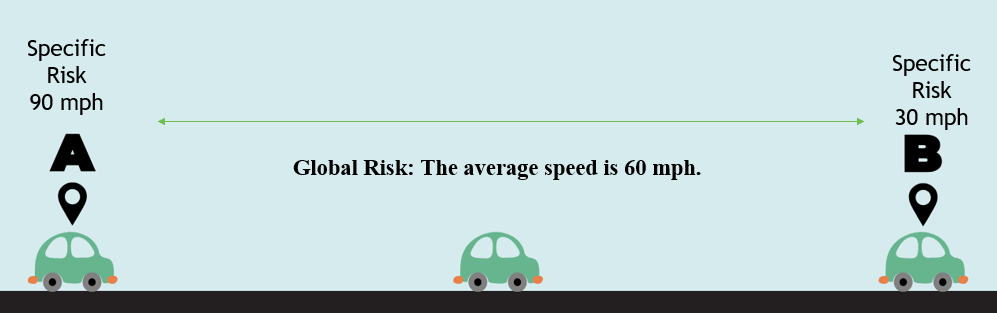
The first measurement occurs as the car enters point A, traveling at 90 mph, and then 0.5 miles into the drive, travels at 30 mph.
When we take our reading, the stopwatch reads 1 minute. The average speed is 60 mph.
This is the difference between specific risk and global risk.
If we wanted to look at the car's speed using Specific Risk, we might have a radar gun at Points A and B.
In this example, the car is clocked at 90 mph at point A and 30 MPH at point B.
Each point is 30 MPH below or above the speed limit. It is a different picture than if we used the system monitoring the average speed.
Specific Risk is based on measuring individual speeds at point A and point B. When measured, we will know the individual measurements of each car at point A and point B.
Global risk is based on measuring the average speed once a reliability target has been met (we took 10,000 data points and found 98 % to be good).
According to our data, about 1 % of drivers will drive over 63 MPH and 1 % below 57 MPH. We may not know the specific speeds at points A and B, though we will know the average speed on the mile stretch of road.
Note: This example may highlight an extreme, though each type of risk method has its place and will be discussed in greater detail in future articles.
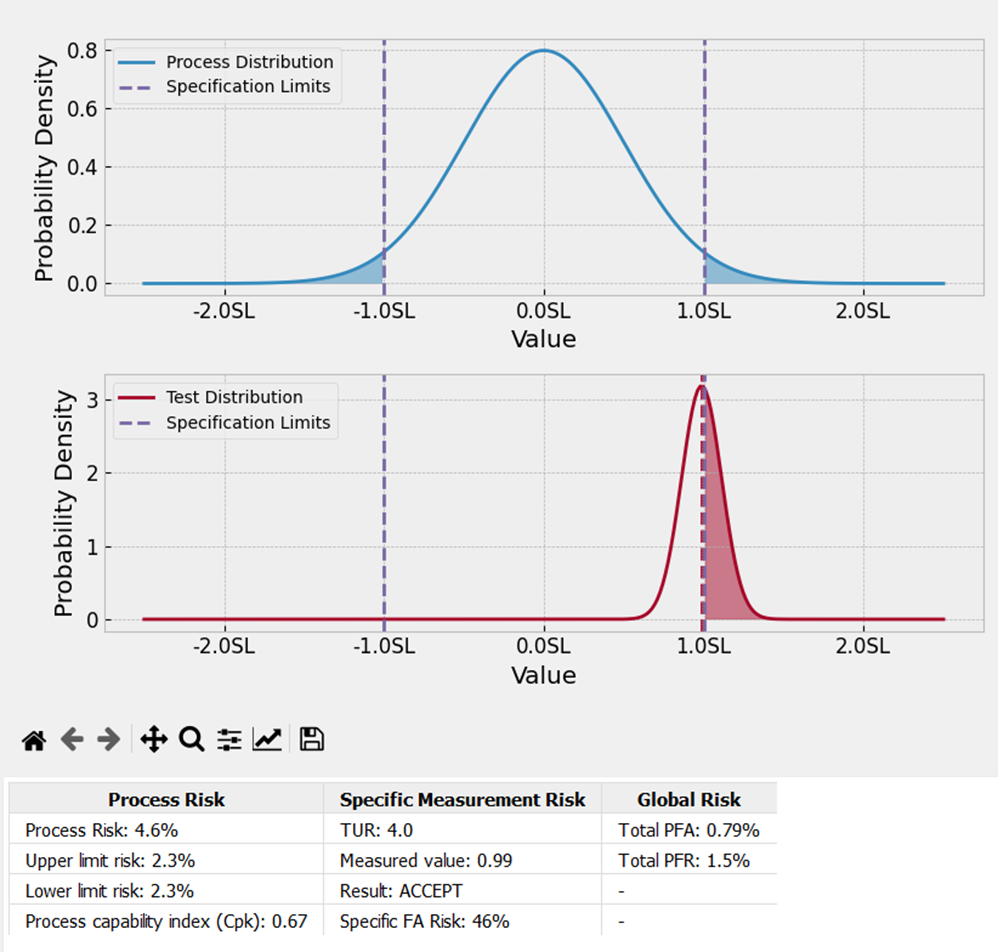
The figure above using SUNCAL software shows both Specific and Global risk. When looking at the bottom Probability density function (Specific Risk), the area outside of the specification limit is 46 % (Shown in Red).
This would be the value for PFA we would use if making a specific measurement; if we combine both probability density functions, we could model a more global approach.
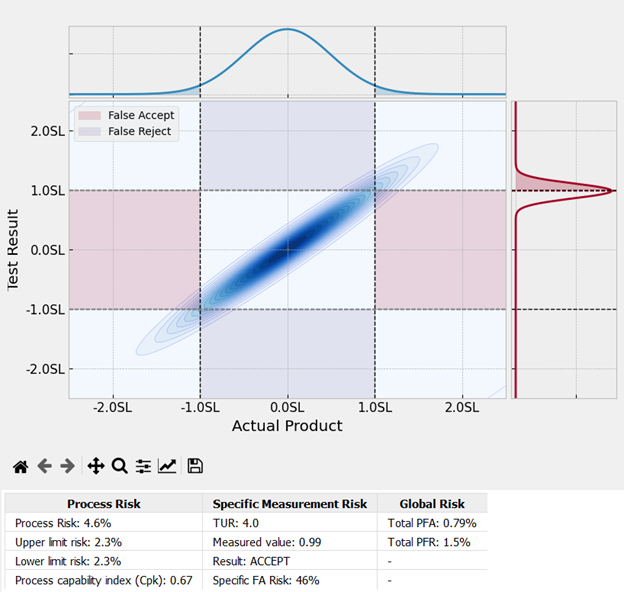
The image above shows that with enough samples, we should expect about 0.79 % of our population data to be accepted when non-conforming and about 1.5 % to be found nonconforming when conforming.
The number drastically differs from when we pulled one piece and measured its performance at a 46 % probability that what is being measured is non-conforming. Global risk often assumes at least one probability density function is centered.
ASME B89.7.4.1-2005 describes both risk levels quite well.
Specific Risk or Bench Level risk mitigation can be considered “controlling the quality of the workpieces,” while program-level risk strategies are described as “controlling the average quality of workpieces.”
Bench level (Specific Risk) is an instantaneous liability at the time of the measurement, and program level (global Risk) is more about the average probability that incorrect acceptance decisions will be made based on historical data.
Specific and Global Risk Conclusion
In conclusion, specific and global risk methods are crucial in metrology. Understanding the differences between them can help make more accurate decisions based on the level of risk tolerance a company may have, reducing the probability of false acceptance and ensuring the quality and reliability of products.
Specific risk is often thought of as controlling the quality of individual workpieces or examining the individual measured values on the test, measuring, and diagnostic equipment (TMDE).
In contrast, global would then be controlling the average quality of workpieces or using an average based on a pool of similar TMDE using reliability targets using the same calibration intervals and TURs.
Global is the risk of the same test point taken across a pool of units.
Furthermore, any decision rule describes how measurement uncertainty is accounted for when stating conformity with a specified requirement.
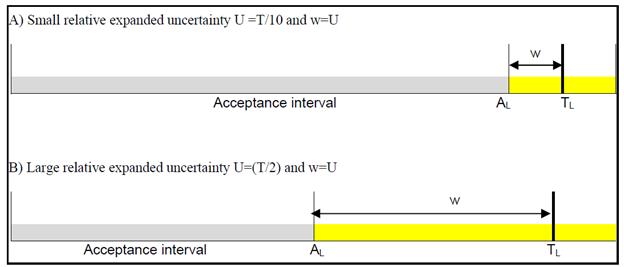
With both specific and global risk, the more significant the measurement uncertainty, the smaller the acceptance interval. The figure above shows a specific risk scenario with a larger acceptance interval when the measurement uncertainty is low and a smaller acceptance interval when the measurement uncertainty is high.
Morehouse uses primary standard deadweight calibrations up to 120,000 lbf for force measurements, ensuring measurement uncertainties are kept low, allowing us to use more comprehensive acceptance limits and "pass" more equipment sent to us for force calibration.
If you enjoyed this content on specific and global risk, check out our LinkedIn and YouTube channel for more helpful posts and videos.
Everything we do, we believe in changing how people think about force and torque calibration. We challenge the "just calibrate it" mentality by educating our customers on what matters, educating on specific and global risk, so that they may understand the differences between the two.
Morehouse makes simple-to-use calibration products. We build fantastic force equipment that is plumb, level, square, and rigid and provide unparalleled calibration service with less than two-week lead times.
Contact us at 717-843-0081 to speak to a live person or email for more information.
# Specific and Global Risk
Specific and Global Risk References
- ASME B89.7.3.1-2001Guidelines for Decision Rules: Considering Measurement Uncertainty in Determining Conformance to Specifications
- ASME B89.7.4.1-2005 Measurement Uncertainty and Conformance Testing: Risk Analysis
- JCGM 106:2012 Evaluation of measurement data – The role of measurement uncertainty in conformity assessment
- ILAC G8:09/2019 Guidelines on Decision Rules and Statements of Conformity
Want to learn more about specific risk? Click here.

