

Load Cell Reliability
A customer asked us about the stability specifications of our load cells. The initial reaction was that no one does that because there are too many variables. Load cell reliability will depend on the complete system and use.
These include using different adapters, different cables, changing thread engagement, overloading load cell, the meter used, and the number of loading cycles.
Finding enough samples meeting the 95 % confidence Interval criteria, with 95 % End of Period Reliability, seemed daunting.
What is required to calculate Load Cell Reliability?
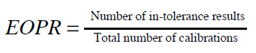
In simplistic terms, End of Period Reliability is defined as the number of calibrations resulting in acceptance criteria being met divided by the total number of calibrations.
Load Cell Reliability Considerations may include:
- Reliability decreases with time after calibration
- How much testing is required to demonstrate Load Cell Reliability with confidence?
- A priori knowledge of the M&TE
This formula to determine "In-Tolerance" Reliability from historical data is easy to replicate in Excel. The formula is Sample Size = ln(1-Confidence)/ln(Target Reliability).
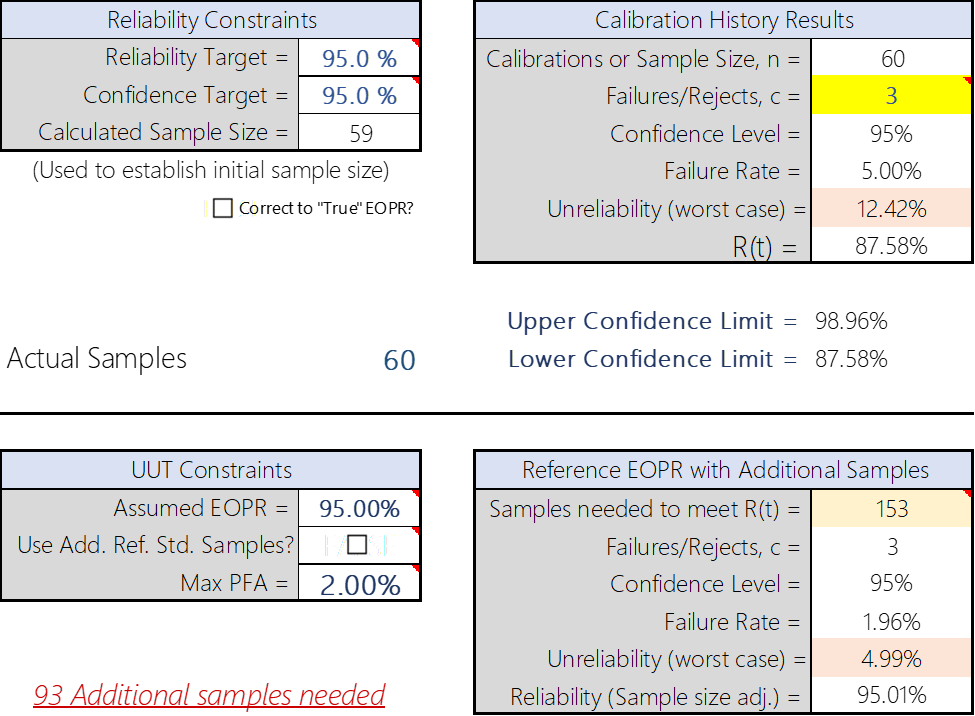
The result of our formula to calculate load cell reliability above would be that we would need 59 samples with 0 failures or rejects.
Knowing that Load Cell Reliability decreases with time after calibration and that most anyone wanting a performance of better than 0.05 % will likely need calibration performed annually, we decided that our sampling needed to include those load cells on an annual calibration cycle.
Thus, we went on to pull 59 samples with a calibration interval of around 365 days to demonstrate Reliability with the appropriate confidence.
Of the 60 samples pulled, 6 failed the criteria of being better than 0.05 % from 10 % of the range to 100 %.
Upon investigation of the six failures, one load cell was found to have a loose calibration top adapter, which warranted removal from the data set. Two of those points were higher than 0.05 %.
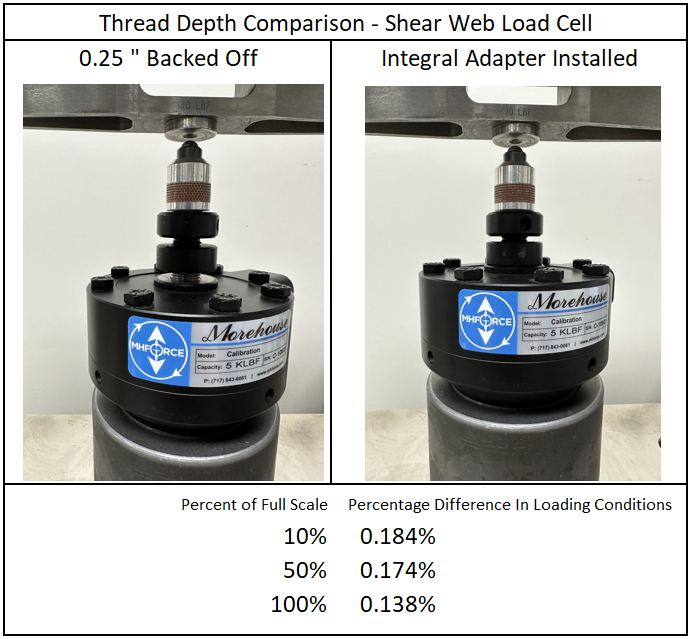
Above is a picture of a Morehouse shear web load cell loaded with the adapter locked in and loaded with 0.8 inches of engagement.
The difference in output is over 0.138 % and enough to demonstrate a priori knowledge that any load cells with loosely threaded adapters could skew the results and should be removed as the adapters are made to be locked in place for a reason.
We have an article explaining thread depth errors on different load cells.
That article can be found here.
Another load cell had an entry error of 45 % instead of 0.045 % (oops).
Thus, after removing one load cell, we sampled an additional load cell, ending with 60 samples and three failures.
According to the initial calculations, we would need another 93 samples for our load cell reliability target based on a one-year stability of 0.05 % or better.
Meaning we would need to continue sampling or raise the stability criteria.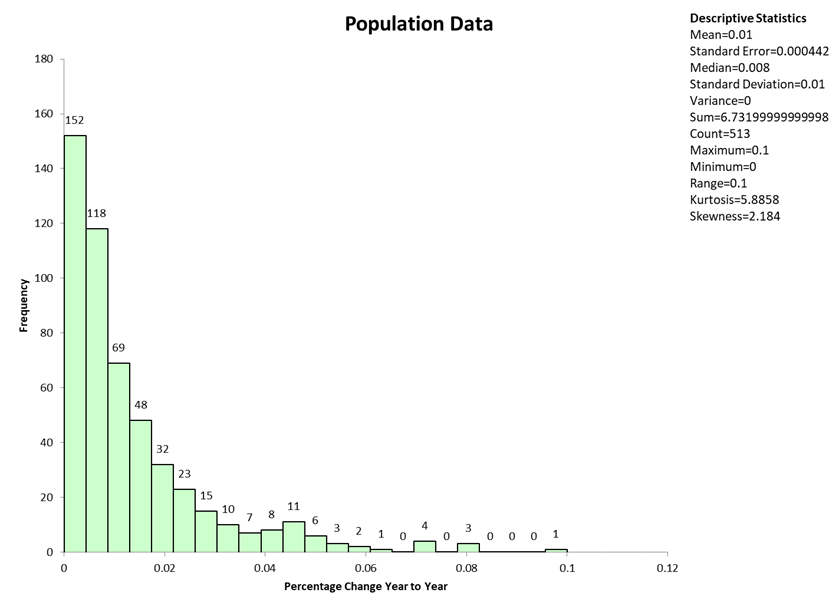
As shown above, we pulled 171 load cells and sampled the stability criteria at 10 %, 50 %, and 100 % test points.
The thought process was anything below 10 % would have too low resolution.
For instance, on a 4 mV/V load cell, a change of 0.00005 mV/V would result in a 0.06 % change at the 2 % point.
Most indicators used for load cell calibrations are not even stable to ± 0.00002 mV/V, which could account for a shift in stability of 0.025 % at a 2 % point.
On top of that, most indicators significantly contribute to the overall Reliability of the load cell.
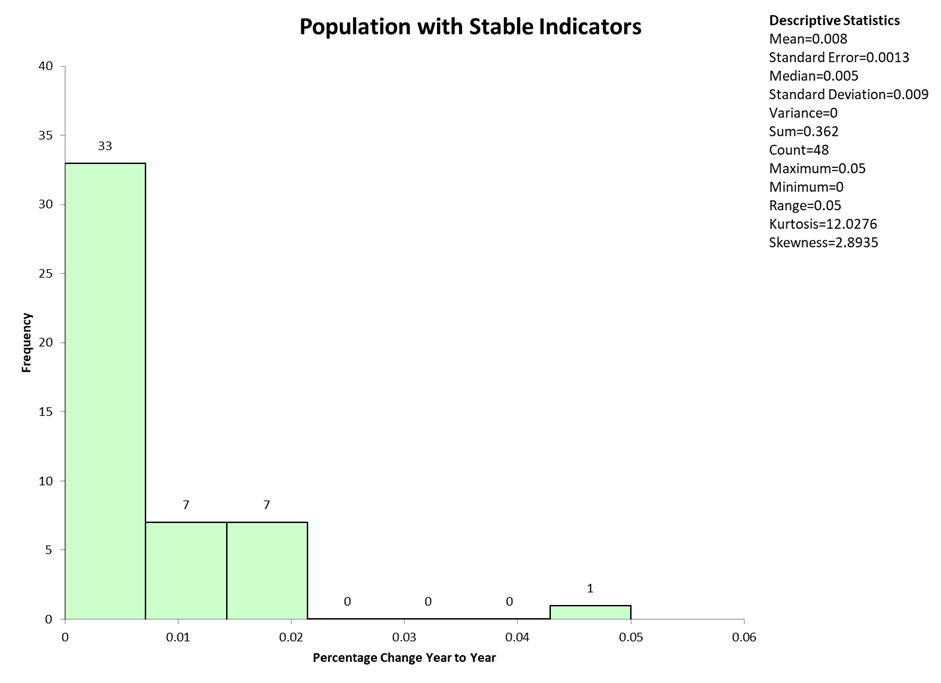
We tested the indicator influencing load cell reliability by pulling out any indicator other than our 3458A and DMP 40.
With the other indicators pullet out, we were left with 48 samples, and only 1 was over 0.02 %, meaning with 95 % confidence, these load cells are at least 91.66 % reliable for a year-to-year change of better than 0.02 %.

With a total of 513 samples from 171 load cells, we had enough data to say with a 95.77 % or better confidence limit that Morehouse load cells from 25 lbf through 1,000,000 capacities paired with a 4215, HADI, Agilent 3458A, HBM DMP 40, or GTM indicator could achieve 0.05 % or better stability for a 1-year calibration cycle when appropriately used from 10 % through 100 % of capacity.
There is more with EOPR as the rules to establish EOPR can be subjective.
Rules such as how many first-time calibrations are counted.
How many broken instruments should be included?
Should we include calibrations with different due dates?
What about post-dating and so on?
We did include the one-year after the initial calibration numbers in the data set on new instruments.
About 20 % of the population data consisted of a load cell and meter combination back for a second calibration.
Including these instruments would tend to skew the data as load cells will experience a shift within their early years of use.
Many would call this a break-in period.
Depending on the load cell and material, the shift could be predictable.
For instance, some material is more likely to have a positive shift in data than others.
Sometimes, the shift is due to material hardening with use, gauging, or other factors.
Whatever the reason, we typically see this occurring during those first few calibration cycles.
Our initial round included load cells paired with good indicators, and three points at 10, 50, and 100 % per load cell were sampled.
Thus, it would be possible for the 50 % and 100 % test points to skew the data.
What if we did a further analysis on the 10 % point?
The Load Cell Reliability at the 10 % Test Point
Of the 14 failures, 9 occurred at the 10 % test point.
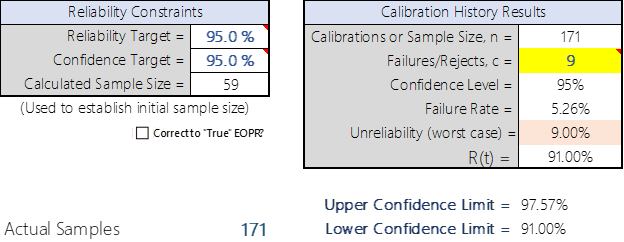
The 10 % test point had a failure rate of 5.26 % of the population.
At the same time, the failure rate of the 50 % and 100 % test points were both under 2 %. At the 50 % point, there were 3 failures out of 171 samples, resulting in 95 % Confidence that the stability is 95.53 % reliable. At the 100 % point, there were 2 failures out of 171 samples, resulting in 95 % Confidence that the stability is 96.36 % reliable.
If we raised the load cell reliability (stability) target to 0.06 %, the 95 % reliability target at 95 % confidence at the 10 % point would become 93.95 %. And a stability target of 0.07 % would result in 95.53 % reliability.
If we lowered the target to 0.032 %, the 95 % reliability target at 95 % confidence at the 10 % point would become 74.43 % for the population.
At the 50 % point, it would be 91.00 %, and at the 100 % point, it would be 91.72 % reliable.
Load Cell Reliability – Conclusion
All load cells or metals will change with frequent loads applied.
Typically, the material becomes harder with usage.
Factors like electrical leakage or metal/heat treatment problems may go either way, better or worse, with time, environment, and cycling.
If that happens, a potential large shift could occur and stabilize.
A good check would be to make sure everything is functioning correctly.
Potential damage has occurred if the system behavior is erratic on the return to zero.
The first few calibration cycles are typically when the most change occurs.
If someone wants to maintain an overall reliability of 95 % with 95 % confidence of 0.05 % or better, then care must be taken in selecting the overall system.
We showed in our data that maintaining 0.02 % stability with high-end indicators is possible.
In our sampling, with 95 % confidence, we were at least 91.66 % reliable when we filtered out the data only to include meters costing USD 15,000.00 or above.
However, there are ways to track the drift of the meter.
A load cell simulator can be used to make sure the meter portion is not drifting.
A simulator is a highly recommended solution to monitor indicator reliability.
Other Comments on Load Cell Reliability:
- Calculating Reliability alone may not be enough to ensure confidence in your measurement.
- Calculating Confidence Intervals properly will give insight into your actual Reliability.
- Typically, many labs struggle with getting enough samples. In this case, ensuring the lab performing the calibrations has low enough measurement uncertainty to pass the M&TE reliably is essential.
- The calibration intervals are set based on end-of-period Reliability and should be shortened if they do not meet the end-user reliability target.
Henry Zumbrun, President of Morehouse Instrument Company
About Morehouse Instrument Company
Companies worldwide rely on Morehouse for accuracy and speed. The company turns around equipment in 7-10 business days so customers can return to work quickly and save money.
The York, PA-based company provides force and torque measurement products and services worldwide.
Morehouse Instrument Company, a trusted and accredited provider of force and torque measurement services for over 100 years, offers measurement uncertainties 10-50 times lower than the competition.
Morehouse helps commercial labs, government labs, and other organizations lower their measurement risk by lowering equipment uncertainties for torque and force measurement. Contact Morehouse at info@mhforce.com.
More Information about Morehouse
We believe in changing how people think about force and torque calibration in everything we do.
This includes setting expectations on load cell reliability and challenging the "just calibrate it" mentality by educating our customers on what matters and what causes significant errors.
We focus on reducing these errors and making our products simple and user-friendly.
This means your instruments will pass calibration more often and produce more precise measurements, giving you the confidence to focus on your business.
Companies around the globe rely on Morehouse for accuracy and speed.
Our measurement uncertainties are 10-50 times lower than the competition.
We turn around your equipment in 7-10 business days so you can return to work quickly, saving you money.
When you choose Morehouse, you're not just paying for a calibration service or a load cell.
You're investing in peace of mind, knowing your equipment is calibrated accurately and on time.
Contact Morehouse at info@mhforce.com to learn more about our calibration services and load cell products.
Email us if you ever want to chat or have questions about a blog.
We love talking about this stuff.
Our YouTube channel has videos on various force and torque calibration topics here.
# Load Cell Reliability

