

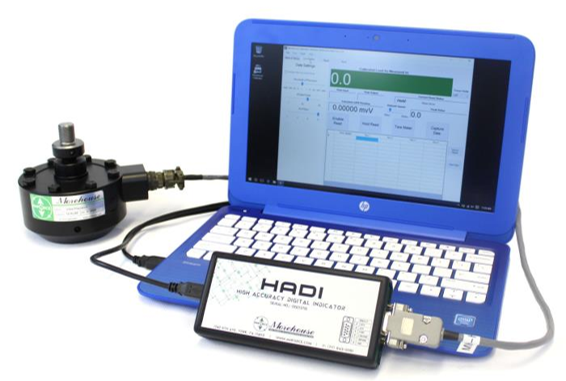
What You Need to Know about Having a Load Cell Calibrated with 2 Ranges
Load cell calibrated with 2 ranges has a common error that can be referred to as Molecule Excitement Decline might explain why the use of a low range calibration on a reference standard can lead to additional errors. This post will explain what molecule excitement decline is and what should be done to minimize the error associated with using a load cell at a high and low range. In the experiment conducted by Morehouse, we chose a 10,000 lbf shear web load cell and tested the repeatability of a 1,000 lbf test point when exercised to 10,000 lbf and when only exercised to 1,000 lbf.
Load cell calibrated with 2 ranges or Dual Range Calibration is a calibration in which a force-measuring instrument is calibrated at two ranges. These ranges are typically high and low range. An example of a dual-range calibration would be performing a calibration from 1,000 lbf through 10,000 lbf (high range) and then performing a calibration from 100 through 1,000 lbf (low range) on a 10,000 lbf force-measuring instrument.
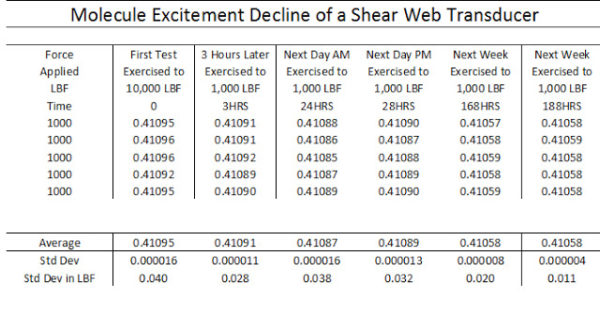
The test data is presented below. For the first test, the load cell was exercised to 10,000 lbf three times and then loaded to 1,000 lbf five times. Changes in the zero-force readings were treated in accordance with ASTM E74.13a Method (b) average zero method. The remainder of the tests was spread over time, and the load cell was exercised to 1,000 lbf three times before being loaded to 1,000 lbf five times.
The above data showing a Load cell calibrated with 2 ranges was compared using ANOVA analysis. Analysis of variance ( ANOVA ) is a collection of statistical models used to analyze the differences among group means and their associated procedures. ANOVA allows us to know if there is an agreement between the means of several groups.

The above data showing a Load cell calibrated with 2 ranges of data from the ANOVA analysis shows significant differences between the tests. The means are not all the same. The ANOVA test comparing 0hrs with 3hrs, 3hrs and 24 hrs, 24 hrs, and 28 hrs, and 168 hrs and 188 hrs did not show a significant difference between the means at 24 hrs and 28 hrs, as well as 168 hrs and 188 hrs. At the start of the test, it was thought that the molecule excitement decline would equalize within 24 hours.
This was not the case. The molecules in the load cell continued to decline. When we decided to test the load cell again, about 5 days had passed since we had the agreement on the means. The ANOVA analysis where we found the agreement was indicated by a P-value of better than 0.05. The P-value is the probability of obtaining a result that is completely uncorrelated with the test variable.
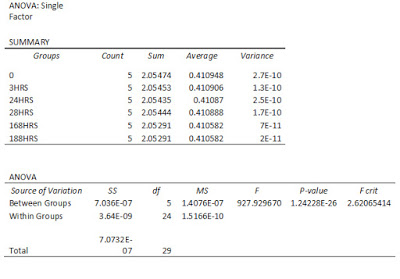
The ANOVA analysis in this post used a significance level (a) of 0.05. An Alpha of 0.05 indicates that a 5 % risk difference exists to get a sample that is not representative of the population. At 168hrs and 188hrs, the P-value was 1. This indicates that there is a very high likelihood of obtaining similar averages by repeating this test. If we loaded the load cell today, we should expect the numbers to agree.
Explaining the Error
The output of each test was analyzed, and the difference from the initial test where the load cell was exercised to 10,000 lbf prior to loading to 1,000 lbf was run.
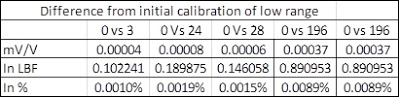
The load cell exhibited a decline in output, which correlated to the amount of time between the additional applications of forces. The potential error ranged from 0.001 % to 0.0089 %. This error could be considered when using the load cell as a secondary reference standard to calibrate other load cells. A Secondary Standard, as defined by ASTM E74-13a, is one that is calibrated by Primary Standards (deadweights) and has a test accuracy ratio of better than 0.05 %. A maximum difference of 0.0089 % was observed.
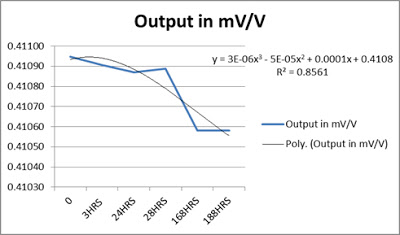
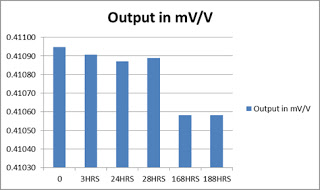
The average output of the tests was plotted. The graph above shows the cell to be repeatable at 168 hrs and 188 hrs. A trend line using a 3rd order polynomial was plotted and came up with an R-squared value of 0.8561. This means the data set fits the line within 85.61 %. An R-squared value of 1 would mean the regression line would perfectly fit the data.
Molecule Excitement Decline: A possible explanation of what is happening in the above tests.
To understand molecule excitement decline, we must first understand kinetic energy. The kinetic energy of an object is the energy that it possesses due to its motion. It is defined as the work needed to accelerate a body of a given mass from rest to its stated velocity. Having gained this energy during its acceleration, the body maintains the same kinetic energy unless its speed changes.
When the force-measuring device is loaded to capacity, the molecules inside the material reach resonate frequencies; we will refer to this as a "Happy State." As the instrument sits, the room temperature causes these molecules to begin to slow. Over time, these molecules will slow to a minimum. As these molecules slow, the kinetic energy decreases.
When the instrument is not loaded to full capacity, the kinetic energy will not reach its full "Happy State." The result of this is less molecule movement, resulting in a change in the load cell output. In our tests, the molecule decline stabilized at some point between 28 hrs and 168 hrs. This can be explained since the molecules in the material declined to a point where the molecules’ frequencies matched that of the temperature of our calibration laboratory. Further molecule decline would continue to happen if the temperature were decreased.
What You Need to Know about Having a Load Cell Calibrated with 2 Ranges
Any force-measuring instrument may exhibit a similar molecule decline. Remember Newton’s First Law of Motion? Things in motion tend to stay in motion; things at rest remain at rest. Exercising a load cell to capacity will put the molecules in motion. The molecule motion will decline over a period of time, and at some point, it will stabilize. The load cell must be exercised to capacity before calibrating to put the molecules back in motion. This may be instrument-dependent.
To minimize any chance of additional measuring error, Morehouse recommends loading the instrument to full capacity prior to using the device to calibrate any force point that is less than the full capacity to which the device was calibrated. For instruments used as Secondary Standards, it is suggested to use two load cells instead of calibrating two ranges on one load cell. To further support this, the limited instrument resolution on a low-range calibration may be a dominant uncertainty contributor, resulting in larger expanded uncertainty than when compared with two separate load cells.

Alternative Explanation For Beer Connoisseurs: Another way to explain this is with the beer curve. My ideal "Happy State" may be reached after consuming 6 good microbrews. If I drink more than 6, I might start to act stupid, and at some point, I will reach a limit that may cause me to "pass out" (overloading a load cell past 150 % will cause damage and is not advised). The load cell is loaded to capacity may be regarded as the same as my state of mind while under the influence of 6 beers. We are both in a "Happy State."
However, as time goes on, I may start to feel less happy. After a few hours, another beer may make me feel happy again, but not as happy as I initially was. Similarly, the load cell being loaded to 10 % of output will cause the molecules to vibrate, but they may not vibrate as much as they would if they were loaded back to full capacity. Furthermore, the longer the delay between beers, the less happy I may become. After a day or two, one beer is no longer going to make me happy again. The same holds true for the load cell: If too much time goes by, loading to 10 % of capacity will not cause as much molecule excitement, and the observed output will be less than what it was when loaded to capacity.
What You Need to Know about Having a Load Cell Calibrated with 2 Ranges - Conclusion
If you enjoyed this article, check out our LinkedIn and YouTube channel for more helpful posts and videos.
Everything we do, we believe in changing how people think about force and torque calibration. Morehouse believes in thinking differently about force and torque calibration and equipment. We challenge the "just calibrate it" mentality by educating our customers on what matters and what causes significant errors, and focus on reducing them.
Morehouse makes our products simple to use and user-friendly. And we happen to make great force equipment and provide unparalleled calibration services.
Wanna do business with a company that focuses on what matters most? Email us at info@mhforce.com.
#Load Cell Calibrated with 2 Ranges

