Load Cell Transitioning from One Mode to Another. Does it Make a Difference?
This post will examine the effects of Load Cell Transitioning by calibrating the load cell in compression by switching to tension and then back to compression versus calibrating in tension first and then compression. We will determine if there is a statistical difference in output from transitioning back and forth between compression and tension on newer load cells.
The reason this may be important is that ASTM E74 section 7.5 requires a test regimen that may not represent what is happening in the field. The current regimen suggests starting the calibration in compression, switching to tension, and then finishing the calibration in compression. The understanding of why transitioning was necessary for the test regimen may date back to the force-measuring devices that were available at the time when the standard was written. Some of the early devices needed to be exercised several times in order for the material to stabilize when being switched from one mode to another.
The lack of stabilization would often affect the load cell creep response and recovery. When a force is applied to a load cell and remains constant, the load cell will drift within a specified timeframe before reaching equilibrium (this assumes the load cell is designed well enough to meet a stable value). This drift is commonly referred to as load cell creep. Load cell creep is the difference between an initial response after a force change and the response at a later time.
Apparently, back in 1974 when the ASTM E74 standard was written, it was much more efficient to start with compression as the first direction for testing, then switch to tension, and then back to compression. The standard was written to start in compression first because the setup in tension was more difficult and more time-consuming. It was much more efficient to make two compression setups as opposed to requiring two tension setups. It is quite probable that some users may only use the load cell for tension in certain applications, or they may start their calibration routine in one mode and switch to another mode.
Load Cell Transitioning null hypothesis is that there is not a difference between the output of a load cell in compression when transitioning from compression to tension and then back to compression.
The null hypothesis (H 0) is a hypothesis that the researcher tries to disprove, reject, or nullify. The 'null' often refers to the common view of something, while the alternative hypothesis is what the researcher really thinks is the cause of a phenomenon. In examining these results, it is very important to note that the load cells that were tested are of a newer variety, and there may be a difference between different types of load cells. The two types of load cells tested were the S-beam and shear web-types.
It is also important to note that field testing requirements are entirely different from primary and secondary laboratory requirements. Even though there may not be a concern about applying the new proposed test regimen to "field" measurements, we would continue to advocate transitioning between modes for instruments used as secondary standards. Without this transition, there is just too much additional risk, and the additional random sampling should better represent the true performance of the device.
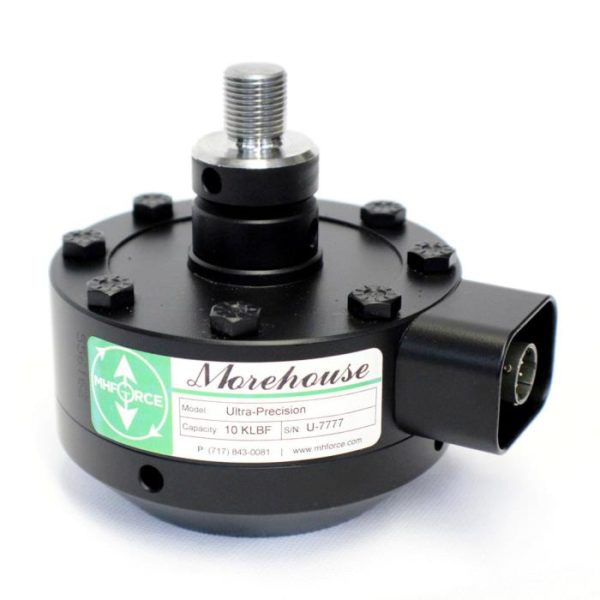
Morehouse Shear Web Type Cell
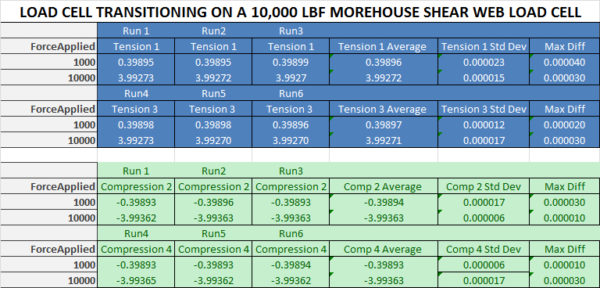
Load Cell Transitioning Comparison Output
The above Load Cell Transitioning data was compared using ANOVA analysis. Analysis of variance (ANOVA) is a collection of statistical models used to analyze the differences among group means and their associated procedures. ANOVA allows us to know if there is an agreement between the means of several groups. The P-values for comparing the same force points in compression and tension ranged from 0.54 through 0.77. These high P-values indicate that there is a very high likelihood of obtaining similar averages by repeating this test. There is enough evidence to conclude that there is not a statistical difference between switching from compression to tension and back to compression again or vice versa.
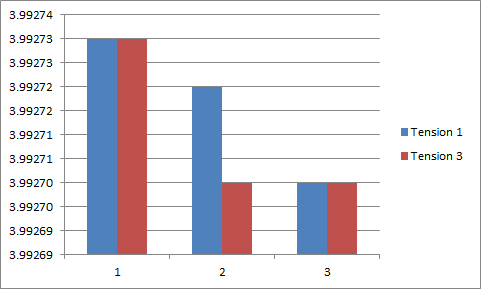
Load Cell Transitioning Comparison Output
A graph of the tension output above shows very good agreement between the output during the first series of tests (blue bar) and the output after switching from compression mode back to tension (red bar). The standard deviation of the difference was less than 0.00002 mV/V, or two counts out of 399,271 total counts. This equates to a difference of about 5 parts per million (0.0005 %).
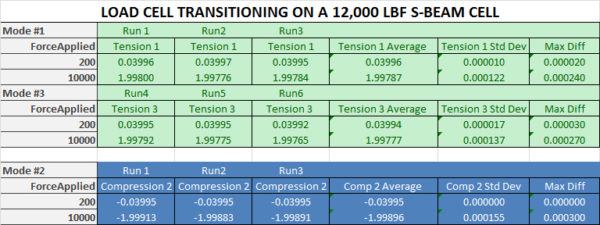
Load Cell Transitioning S-Type Cell
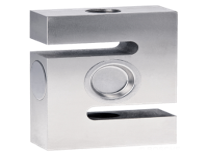
S-Beam type load cell

| Load Cell Transitioning ANOVA ANALYSIS |
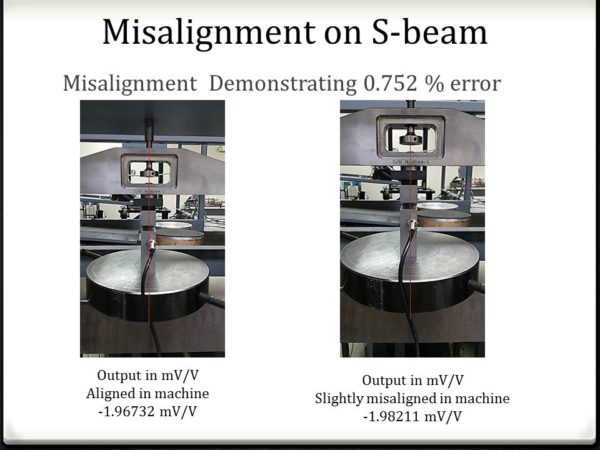
The Load Cell Transitioning tests was run on a 10,000 lbf S-beam cell (these tests were run by 2 different laboratories and calibration was performed at 10,000 lbf and 12,000 lbf to see if taking the load cell beyond capacity made a difference). The results are fairly consistent with those of the shear web-type cell. The S-beam test had more variation in rotation, probably due to the fact that S-beam cells are very susceptible to misalignment errors. We have run a misalignment test on the misalignment of a shear web versus an S-beam. Figure 4 shows the S-beam misalignment error below. The Morehouse shear web cell repeated within 0.0022 % when misaligned the same 1/16 of an inch. The S-beam only repeated with 0.752 %.
Load Cell Transitioning Conclusion:
Both of these load cells show that there is no difference between transitioning from tension to compression and then back to tension, proving the null hypothesis to be correct. The major caveat to this method is that the load cells must be exercised at least 3-4 times prior to making any measurements. Failure to exercise the cells when a mode transition is made will result in significant error.
The question remains if section 7.5 of the ASTM E74 standard should be changed to allow for only compression and tension calibration without requiring a transition back to the chosen starting mode. After reviewing these and numerous other instruments, my opinion is that for Class A devices, this may not make any statistical difference; however, with Class AA, a stricter testing regimen may be warranted. With tolerances of 0.05 %, the difference of 0.005 % on the S-beam cell may create too much additional error for a Class AA calibration (10 % of allowable tolerance). Class A tolerance of 0.25 % makes the transitioning difference insignificant (less than 2 % of allowable tolerance).
Update May 2016: This change was proposed to the E28 committee, and it was decided that there is not enough evidence to change section 7.5.
If you enjoyed this article, check out our LinkedIn and YouTube channel for more helpful posts and videos.
Everything we do, we believe in changing how people think about force and torque calibration. Morehouse believes in thinking differently about force and torque calibration and equipment. We challenge the "just calibrate it" mentality by educating our customers on what matters, and what causes significant errors, and focus on reducing them.
Morehouse makes our products simple to use and user-friendly. And we happen to make great force equipment and provide unparalleled calibration services.
Wanna do business with a company that focuses on what matters most? Email us at info@mhforce.com.
#Load Cell Transitioning


