

Treatment of Zero in Determining Deflections – ASTM Method B Interpolated Zero Reduction Methods
In calibration, many disciplines take multiple calibration points between the initial zero and the ending zero. What is the standard method for reducing the zero readings from the raw data recorded?
When we started asking some contacts at National Metrology Institutes (NMI), we were surprised that the methods for interpolating zero values between the beginning and ending zero did not agree. Not only did they not agree, but they also didn't match an interpolation many in the industry use.
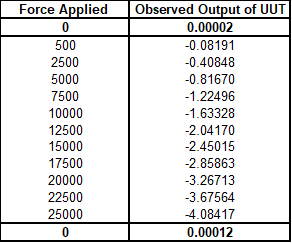
Figure 1 Load cell data with beginning and ending zero values
This article explains three methods for reducing data by interpolating a beginning and ending zero between a series of observed measurements. Since we are a manufacturer and service provider for force and torque equipment and the calibration of force and torque equipment, we chose to use standards such as ASTM E74, ASTM E2428, and ISO 376.
These standards call for interpolation of zero; when a series of applied forces (ASTM E74, ISO 376) or torques (ASTM E2428) are applied before returning to zero force, a series of interpolated zero force readings may be used for the calculations. ASTM E74 & E2428 specifically reference this as method (b). Hence the title Method B Interpolating Zero Readings. Even though the examples relate directly to these standards, they can be applied to any discipline that takes multiple data points between a beginning and ending zero.
We are going to look at several sets of data from load cells. However, let us first explain the three methods we will compare for the interpolation of zero.
We have found the methods from discussions with NIST force group, NPL force group, and other calibration labs in the US.
These methods and formulas are as follows:
| Formula | |
| NIST | X - (0start + (0end - 0start) * (Xpos - 1) / (n - 1)) |
| General Industry | X - (0start + (0end - 0start) * Xpos / n) |
| NPL | X - (0start + (0end - 0start) * Xpos / (n + 1)) |
Where:
- 0start - Zero-force reading immediately proceeding the force series
- 0end - Zero-force reading immediately following the force series
- n - The number of force points in the series (excludes Zero-forces)
- X - The force reading
- Xpos - The position of X in the series, starting at 1 (excludes Zero-forces)
We get the following results when we apply the different methods for subtracting the beginning and ending zero in the above data set.
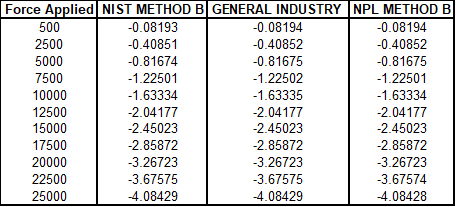
Figure 2 Data reduced using each of the three methods
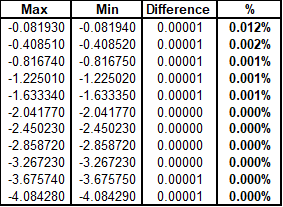
Figure 3 Differences in the reduced data
The above figure shows what happens when we compare the different methods and subtract the maximum from the minimum value.
Polynomial Equation
In general, most load cells are not perfectly linear, and this can range from a very linear cell at 0.01 % to 0.5 %. Typically, most well-designed load cells have nonlinearity specifications of better than 0.05 %.
Using coefficients instead of a standard straight line (y = mx + b) equation almost always allows for a better prediction of the deflection values throughout the range of non-zero data points.
The polynomial equation is highly recommended because it compensates rather well for the nonlinearity of the calibration curve.
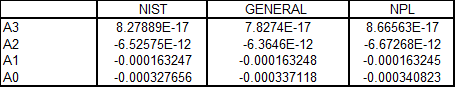
Figure 4 Different coefficients
ASTM E74, ASTM E2428, ISO 376, and other standards may use polynomial equations better to characterize the performance characteristics of continuous reading measuring equipment. These standards may use higher-order fits such as a 2nd or 3rd-order fit (ISO 376) or up to as high as a 5th-order fit (ASTM E74, E2428).
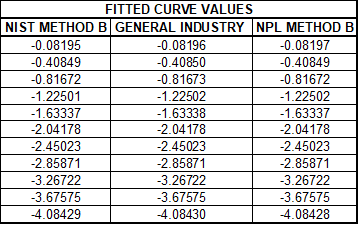
Figure 5 Fitted curve values generated from the polynomial equations in Figure 4
These standards use observed data and fit the data to a curve. In simple terms, these higher-order fits give instructions on predicting an output given a measured input.
That output can either be the force or torque at a specific response or the response when the force or torque is known. We can use these equations to accurately predict the appropriate coordinate for any point in the measurement range, typically above the first non-zero point on the curve.
Several standards use calculations where the reduced data (deflection values) are subtracted from the predicted response. These differences can be called deviations from the fitted curve or residuals.
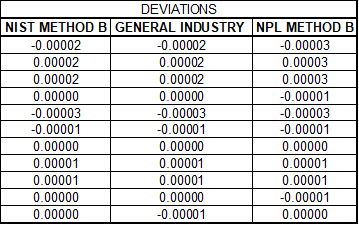
Figure 6 Deviations from the predicted response
The deviations or residuals are then used to calculate a standard deviation. Different standards might use different methods to calculate the standard deviation. For instance, ASTM E74 & 2428 use a formula where the denominator, instead of n- 1 (number of observations - 1), uses N-M-1 (Number of observations – degree of the polynomial fit – 1).
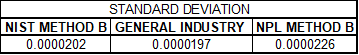
Figure 7 Standard deviation using N-M-1 as the denominator
The standard deviation is then multiplied by the calculated resolution.
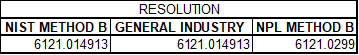
Figure 8 Resolution calculation
For these examples, the resolution was calculated by dividing the force applied by the deflection.
The llf is then calculated by multiplying the resolution times the standard deviation.

Figure 9 shows the calculated llf and differences in percentage between the different reduction methods
The initial data set shows a difference of 13.974 % on a good load cell. This means there will be the same percentage difference in calculating the Class A and AA ranges for ASTM E74 and E2428.
For the examples presented, we will look mainly at the impact of the differences between the methods and the impact on the LLF (Lower Limit Factor)
Various Examples:
High-Stress Single Column Load Cell
Now, let us compare the methods and how they impact the results: the reduced data, the deviations from the calibration equation, and the llf (lower limit factor). We can look at various data sets and the impact of different zero-reduction methods.
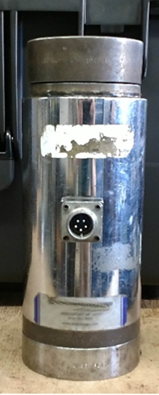
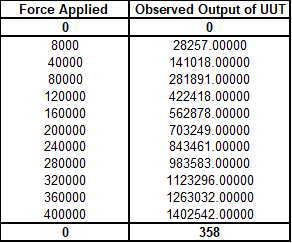
Figure 10 A single column 400,000 lbf load cell and data
Our first is a high-stress (single column) load cell that has a high zero return after 30 seconds. These load cells typically have high zero return errors.
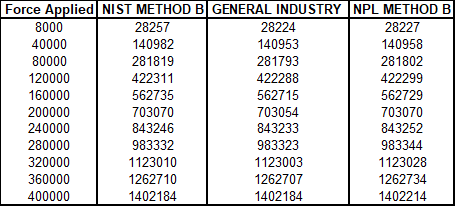
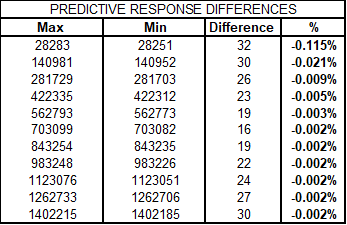
Figure 11 Differences in predicted responses

Figure 12 High-stress load cell llf differences
The data on this load cell shows a significant difference at the first calibrated point. However, when evaluating the actual impact, the first 10 % of the range has differences that might be significant, though overall, the calculation of the LLF is not impacted nearly as much as the first example.
Shear Web Load Cell with a Low Relative Zero Error
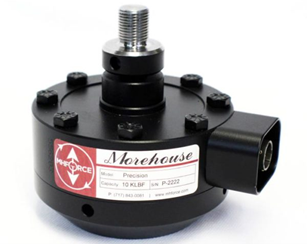
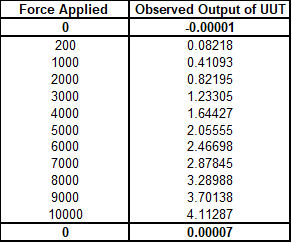
Figure 13 Morehouse 10k shear web load cell
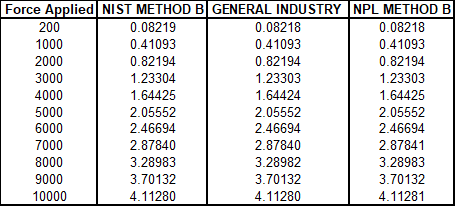
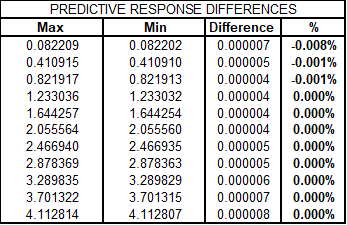
Figure 14 Differences in predicted responses

Figure 15 Shear web load cell llf differences
Additional Information
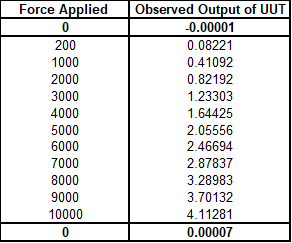
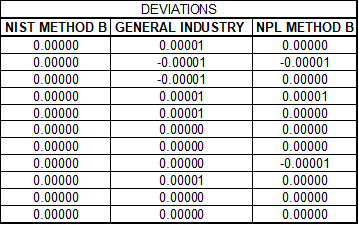
Figure 16 low deviations by using the predictive response in the raw data

Figure 17 low deviations showing higher differences in the LLF
We could continue to sample more load cells and data sets. However, the most impacted are load cells with low deviations and a zero return that causes other errors due to the calculation. For example, if the ending zero in Figure 16 were 0.00005, the LLF difference would be 17.8065 %; if the zero were 0.00009, the LLF difference would be 50.4096 %.
This makes sense because the slightest change in data caused by the different methods can significantly impact the overall results.
Thus, load cells with excellent performance characteristics in relation to how well the data can fit the polynomial equation are impacted the most. Those with high zero returns of more than 1 % of capacity are also impacted. Though if the relative zero error is over 1 %, the load cell should likely be replaced anyway.
So, which method is the best?
That depends on what assumptions people follow.
The NPL method may make the most sense if the zero drifts linearly with time throughout the run. This assumes that the initial zero is not the zero when the first force reading is taken, and the final zero is not the zero when the final force reading is taken. The logic behind this is that the moment a force is applied, the unit immediately begins to deflect, not after the first non-zero point is captured. Likewise, the last non-zero point in the series will still be deflecting while under load.
The general industry method has shortcomings where you only have one applied force; it would result in just the final zero being subtracted from the output under load rather than the average of the two zeroes, as specified in E74. Additionally, there is a disproportionate effect from the beginning and ending zero points, with a bias towards the ending zero point. The reading captured at the ending zero reading will affect all points more than the beginning zero reading. The more points in a given series of points, the more this bias is realized.
The NIST method treats the zeroes symmetrically at the start and finish. However, it doesn't allow for any change in zero between the zero force readings and adjacent readings under load. The understanding here is purely from a mathematical perspective and how two values proportionately affect a series of readings. This approach aims to interpolate the beginning and ending zero ratios to average out to a 50% ratio, or 1:1.
Reading about interpolation in the metrology handbook for several data sets doesn't agree with any of the three methods here 100 %. This may be due to numbers in the calculation that cannot be observed, such as rounded values for display purposes. However, it more closely aligns with the NPL method and rationale.
Interpolated Zero Reduction Methods- Conclusion
Standardization or reporting of the method used to reduce the data sets in determining deflection should be reported to the end user. If the method is not reported, the laboratory should be able to provide the method if asked. The most significant differences in comparing these three interpolation methods occurred on devices that showed the lowest deviations from the predicted values. This means the better your measuring device, the more likely the difference in these methods will impact the results.
For more information on ASTM E74, see our other blogs here.
If you enjoyed this article, check out our LinkedIn and YouTube channel for more helpful posts and videos.
Everything we do, we believe in changing how people think about force and torque calibration. We challenge the "just calibrate it" mentality by educating our customers on what matters and what causes significant errors and focus on reducing them.
Morehouse makes simple-to-use calibration products. We build awesome force equipment that is plumb, level, square, and rigid and provide unparalleled calibration service with less than two-week lead times.
# Interpolated Zero Reduction Methods
Contact us at 717-843-0081 to speak to a live person or email mailto:info@mhforce.com for more information.

