

Which Force Machine Should I Choose?
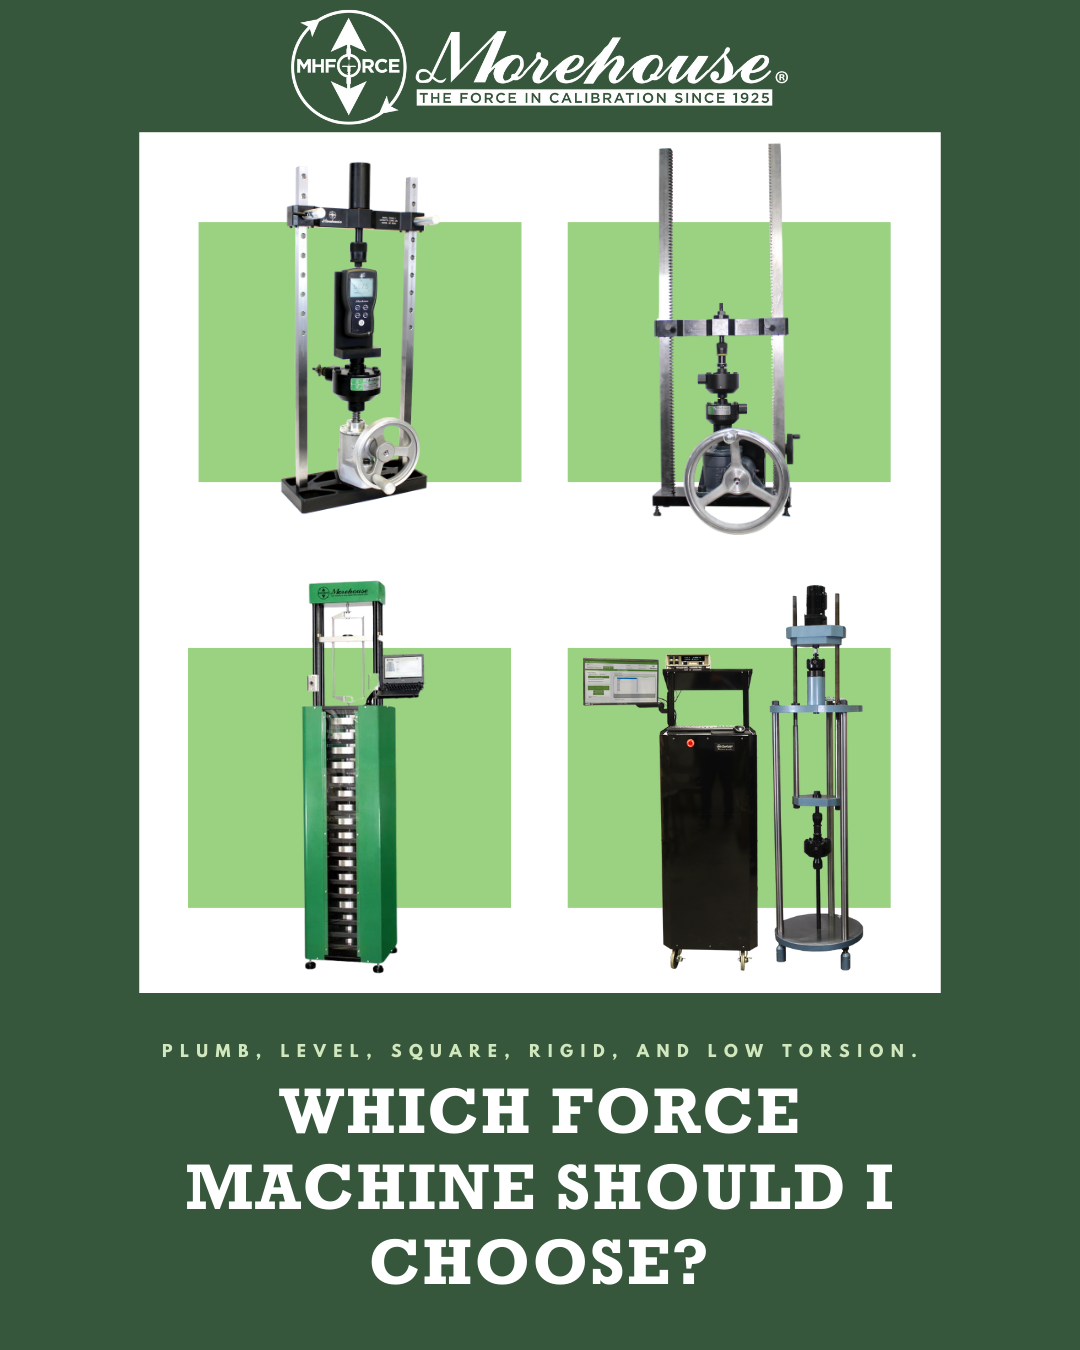
Anyone in metrology has asked—or been asked—this question at some point: “What’s the right force machine for my application?”
How do you decide? Word of mouth? A manufacturer’s reputation? Measurement uncertainty? Overall quality? Price? Or some combination of them all?
It’s a lot like buying a car.
When someone buys a car, the choice rarely comes down to just one thing. Some people are drawn to design and brand appeal. Others focus on reliability, performance, or price. Still others want comfort, advanced safety features, fuel efficiency, resale value, low maintenance costs, or financing options. And, of course, practicality matters; will it fit the family, the commute, or the road trips?
So, when someone asks, “Which force machine should I choose?” or “Why should I use your company for calibration?” it’s tempting to joke, “Well, we don’t know… should you?” But the truth is, most decisions boil down to three things: price, quality, and lead time.
The problem? Very few people dig deep into what those mean.
---
Beyond the Sticker Price
Price isn’t just the sticker cost; it’s the total cost of ownership. Think back to that car analogy. The number on the windshield is only the beginning. You also must consider fuel efficiency, maintenance schedules, insurance premiums, and resale value.
Some cars look like bargains up front, but drain your wallet later in repairs. Others may cost more initially but pay off in the long run through reliability, lower upkeep, and higher resale value.
Force machines and calibration work the same way. The cheapest option isn’t always the cheapest once you factor in downtime, rework, or slower lead times that cost your business money. The real question is not “what’s the lowest price?” but “which choice gives me the best value over time?”
---
Cost of Ownership of a Force Machine
The total cost of ownership of a force machine usually comes down to two main points:
1. Annual or semi-annual costs of maintaining the equipment.
o This includes reliability, ease of use, cycle time, and the cost of having references calibrated.
Example: Compare a 1,000 lbf Morehouse Deadweight Machine with a PCM.
o The Deadweight machine might cost ~5× more than the PCM up front.
o Both are reliable and require similar maintenance.
o The Morehouse PCM typically uses at least two load cell reference standards that must be calibrated annually, adding ongoing costs and downtime.
o The Morehouse Deadweight, on the other hand, only needs periodic validation, and calibration intervals can stretch into decades with proper trending and detection.
What happens if a reference is out for three weeks—one in transit, two in the vendor’s lab? That’s lost revenue. Add in the risk of mishandling or damaging a load cell, and the long-term costs become real.
Using simple math: if one week of operation pays for 2.5 % of the Deadweight’s total cost, three weeks of downtime equals 7.5 %. Add another 2.5 % annually for calibrations, and suddenly, the Morehouse Deadweight starts looking more cost-effective after about 10 years. Factor in interest and opportunity costs, and breakeven comes closer to 13 years.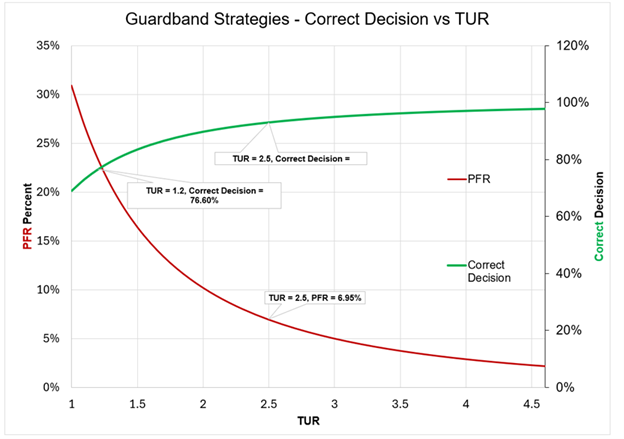
Figure 1 Overall, higher TUR drives risk down and decision confidence up. At TUR ≥ 4, decisions are >95% correct, with PFR nearly zero—image Courtesy of Greg Cenker.
Note: The above graph uses Global Risk to calculate the PFA and PFR. This assumes one is using average population data. The PFR will get much worse when using specific risk or bench-level measurements.
- Measurement Uncertainty in relation to what you’re calibrating.
- Here, we’re not just talking about uncertainty, but the Test Uncertainty Ratio (TUR) or Measurement Capability Index (Cm), the ratio of the tolerance you need to the uncertainty of your calibration.
As TUR increases, the chance of making the right decision goes up:
-
- At TUR 1.2:1, the correct decision is only ~76 %.
- At TUR 2.5:1, it improves to ~93 %.
- At TUR ≥ 4:1, it’s better than 97 %.
- At TUR ≥ 4.6:1, it’s better than 98 %.
Meanwhile, the Probability of False Reject (PFR)—rejecting something good—plummets:
-
- At TUR 1:1, PFR is over 30 %.
- By TUR 2.5:1, it’s under 7 %.
- At TUR ≥ 4:1, it’s under 3 %.
- At TUR ≥ 4.6:1, it’s under 2 %.
Putting Numbers to It
Let’s assume we’re calibrating devices with a 0.1% tolerance. Three possible machines:
- Morehouse BCM — Uncertainty 0.05 % (TUR 2:1)
- Morehouse UCM — Uncertainty 0.033 % (TUR 3:1)
- Morehouse Deadweight Machine — Uncertainty 0.002 % (TUR 50:1)
Here’s what that looks like in practice:
| TUR | Correct Decision | PFR (False Reject) | Avg. Cost per Decision @ $50 ½ hr. |
| 2:1 | ~90–92 % | ~9–10 % | $4.50–$5.00 |
| 3:1 | ~95–96 % | ~4–5 % | $2.00–$2.50 |
| 50:1 | ~100 % | ≈0 % | ≈ $0.00 |
If you do 1,000 calibrations a year:
- The BCM (2:1) costs you about $5,000 annually in hidden rework.
- The UCM (3:1) cuts that to about $2,500 annually.
- The Deadweight (50:1) avoids that cost entirely.
So if a UCM costs $15,000 more than a BCM, rework savings alone cover that difference in ~6 years.
And if your devices require tighter tolerances (say 0.05 %):
- At 1:1 TUR, hidden rework costs jump to $17.50 per decision.
- At 1.5:1 TUR, that drops to ~$8.
- At 25:1 TUR, it’s essentially $0.
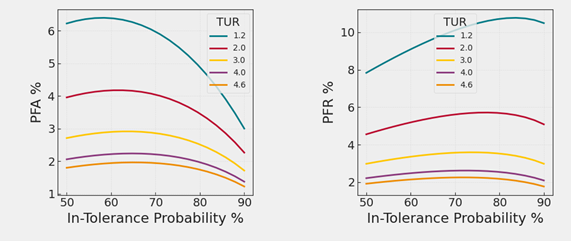
Figure 2 At low TUR, both false acceptance and false rejection risks rise significantly. Higher TUR compresses both risks to negligible levels.
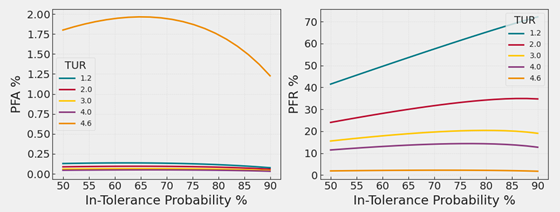
Figure 3 Using a Specific Risk Model, Bench Level Measurements, subtracting U 95 % from the Acceptance Limits.
The above Figure Specific Risk False Rejection (PFR %)
This is the dominant risk driver.
- At low TUR (1.2), PFR is very high — starting near 40 % at 50 % in-tolerance probability and rising toward ~70 % at 90 % in-tolerance probability.
- This means more than half of the “good” items would be incorrectly rejected.
- At TUR = 2.0, PFR is still significant (~25 % to 35 %).
- At TUR = 3.0, PFR drops to ~15–20 %.
- When TUR is small, the measurement is relatively “noisy” vs. the spec, so to meet the ITP target, the rule pulls the pass limits well inside the spec. That crushes the chance that an out-of-tolerance item sneaks through → PFA ≈ 0 % (but you pay with lots of false rejects, as the PFR panel shows).
- At TUR = 4.0 and 4.6, PFR becomes very small (approaching 0 % at 4.6).
- At TUR = 4.6, uncertainty is already so small that the ITP target can be met with little or no guardband. You’re basically testing right at the spec limits. That keeps PFR tiny, but it no longer suppresses PFA, so you see the residual ~1–2 % false-accept risk from the remaining measurement error. Hence, the “high” orange curve only for 4.6.
- Takeaway: Higher TUR dramatically reduces false rejections, which is the main benefit of moving from 2:1 → 3:1 → 4:1 TUR. At 4.6:1 or higher, you’re basically testing right at the spec limits. That keeps PFR tiny, but it no longer suppresses PFA, so you see the residual ~1–2 % false-accept risk from the remaining measurement error. Hence, the “high” orange curve on the left for 4.6:1 TUR.
- Lower TUR ⇒ big guardband ⇒ tiny PFA / big PFR; very high TUR ⇒ minimal guardband ⇒ small PFR / PFA not additionally squashed.
- A lower TUR and higher PFR increases the chance you’ll wrongly fail a customer’s equipment — forcing unnecessary costs, extra analysis, and even potential recalls, all because of a bad decision.
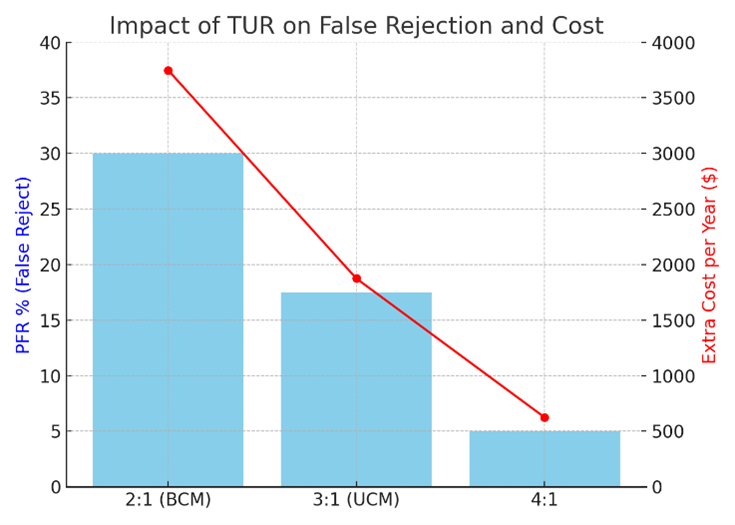
Figure 4: Specific Risk Costs Comparisons versus TUR.
For example, using a Specific Risk model, switching from a 2:1 TUR (BCM) to a 3:1 TUR (UCM) would cut false rejections in half. Instead of rejecting about 300 calibrations, you might reject only 150. At an operating cost of $50 per hour ($25 for 30 minutes), that means the BCM would cost about $3,750 more per year in wasted work.
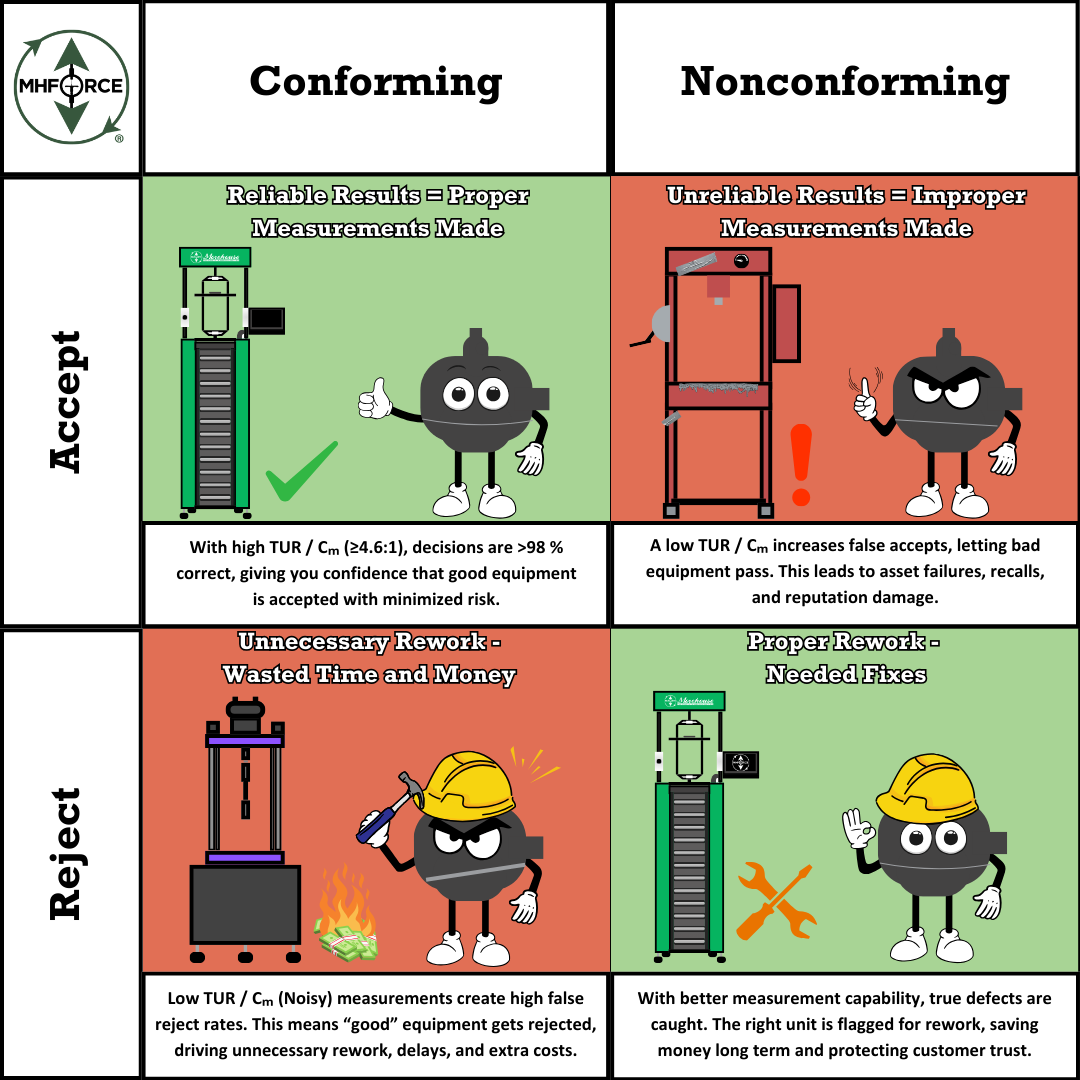
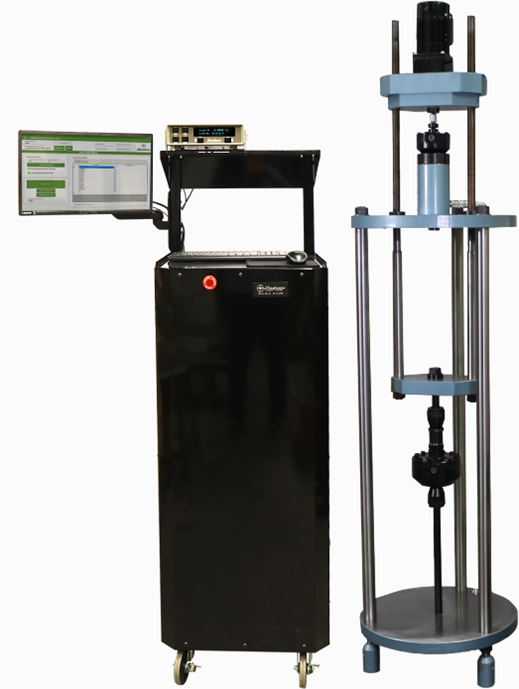
Figure 5: The Morehouse Automated Calibrating Machine Can Often Achieve a MU of better than 0.025 %.
Note: If you use Morehouse Automation with UCM and several load cells, you can typically reach a TUR of about 4:1, which is the safe zone for calibration. At this level, false acceptance is almost gone, false rejection is much lower, and decisions are much more reliable.
The Bottom Line
It’s less about the upfront price tag of the force machine and more about the total cost of ownership.
Every hour you spend waiting for equipment, redoing work, or sorting out quality issues is time you’re not making money, and potentially harming your reputation.
Every wrong decision can result in unnecessary costs, extra analysis, and even potential recalls, all due to a “bad” decision from using equipment or suppliers with high measurement uncertainties.
Choosing the right force machine means looking beyond sticker price to the full picture: downtime, maintenance, uncertainty, and rework. The real value lies in performance, reliability, and the confidence that every calibration decision you make is the right one.
Simply put, A lower TUR can help Stop Rework and allow you to Start Saving more time and money.
More Information about Morehouse
We believe in changing how people think about Force and Torque calibration in everything we do, including discussions on force calibration procedures
This includes setting expectations and challenging the "just calibrate it" mentality by educating our customers on what matters and what may cause significant errors.
We focus on reducing these errors and making our products simple and user-friendly.
This means your instruments will pass calibration more often and produce more precise measurements, giving you the confidence to focus on your business.
Companies around the globe rely on Morehouse for accuracy and speed.
Our measurement uncertainties are 10-50 times lower than the competition, providing you with more accuracy and precision in force measurement.
We turn around your equipment in 7-10 business days so you can return to work quickly and save money.
When you choose Morehouse, you're not just paying for a calibration service or a load cell.
You're investing in peace of mind, knowing your equipment is calibrated accurately and on time.
Through Great People, Great Leaders, and Great Equipment, we empower organizations to make Better Measurements that enhance quality, reduce risk, and drive innovation.
With over a century of experience, we're committed to raising industry standards, fostering collaboration, and delivering exceptional calibration solutions that build a safer, more accurate future.
Contact Morehouse at info@mhforce.com to learn more about our calibration services and load cell products.
Email us if you ever want to chat or have questions about a blog.
We love talking about this stuff. We have many more topics other than force machines.
Our YouTube channel has videos on various force and torque calibration topics here.
# Force Machine

