

Dual-Range vs. Dedicated Load Cell Scope. This article summarizes what our calibration certificates show over many years when the same load cell is calibrated in a low range (LO) and a high range (HI). All findings below are derived from the calibration data provided (ASTM LLF history, standard deviation, stability between calibration, and deviations on the calibration reports.)
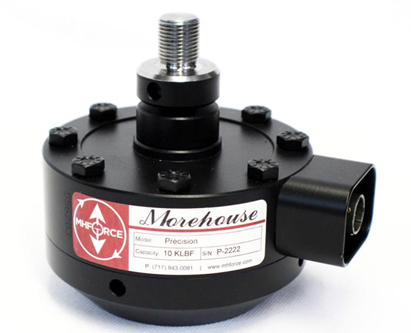
Example: of a 10,000 lbf load cell calibrated at 10,000 lbf (HI) and 1,000 lbf (LO).
1. What HI and LO Range Mean (in plain terms)
A single load cell can be calibrated over different force spans. The HI range is the upper span (higher applied forces). The LO range is a lower span (lower applied forces). These are not different sensors, just different verified operating ranges of the same sensor.
Calibrating a load cell with both a HI and LO range or a Dual range might make sense, depending on the application.
Dual-range calibration certificates can be useful because they allow a single load cell to be used over an extended operating range. However, they do not guarantee identical performance in both spans (HI and LO).
To better understand how performance compares between ranges, we sampled over 30 load cells across four different manufacturers and multiple load cell designs. These included a variety of capacities and calibration histories.
While it is possible that exceptions exist, the overall behavior was remarkably consistent across the full sample.
For clarity and readability, we are highlighting 6 representative load cells in the detailed analysis below. These 6 were selected because they clearly demonstrate the same patterns observed across the entire 30-load-cell population.
Across the broader sample, the same general conclusions held: performance in the low range behaves differently than performance in the high range, and the differences are repeatable across manufacturers and designs.
2. Data Sets and Ranges Reviewed
The analysis includes all uploaded calibration certificates for the following load-cell groups and calibrated ranges:
| LO range max (lbf) | HI range max (lbf) |
| 600 | 6,000 |
| 2,500 - 2,600 | 26,000 |
| 5,000 | 50,000 |
| 6,000 | 60,000 |
| 100,000 | 300,000 |
| 60,000 | 600,000 |
Note: For comparisons, each calibration’s LLF is normalized to the maximum applied force used in that specific range. One of the load cells had a LO range which varied depending on the customer's request.
3. What Metric We Compare (and why)
The primary number we decided to compare was the ASTM E74 Lower Limit Factor (LLF), reported in force units (lbf). However, LLF is reported on the force scale of the range being calibrated. This means LO-range LLF will often look “smaller” simply because the forces are smaller.
To compare ranges fairly, we reduced the data using these metrics:
• LLF%Max = LLF / (maximum applied force in that range)
• StdDev%Max = standard deviation of residuals / (maximum applied force in that range)
These normalize the results to how each range is actually used.
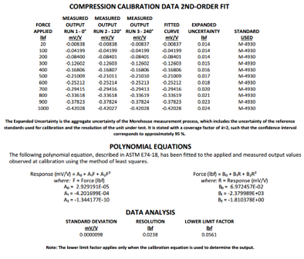
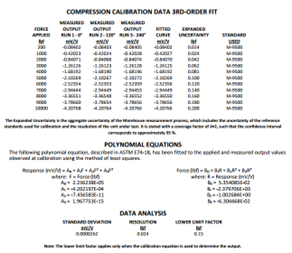
Comparing the HI and LO range certificates on the 10,000/1,000 lbf load cell above. The LLF for the LO range is about 2.67 times lower than for the HI range. However, when comparing to % of maximum force, the HI Range is 0.0015 % and the LO Range 0.0056 %. The LLF for the LO range percentage-wise was 3.73 times higher.
4. Results: What the Multi-Year Data Shows
4.1 LLF normalized to range maximum (all load cells)
Figure 1 shows LLF expressed as a percent of the maximum applied force for each calibrated range, plotted over time for every load cell and for both HI and LO spans.
This removes the misleading effect of comparing LLF in absolute force units (lbf) across drastically different force spans. A smaller LLF in pounds does not necessarily mean better performance if it represents a larger fraction of the usable range.
For example, a 2 lbf LLF in a 100 lbf range represents 2 % of that range, while a 10 lbf LLF in a 10,000 lbf range represents only 0.1 % of that range. Comparing 2 lbf to 10 lbf directly would suggest the 2 lbf case is “better,” when it consumes far more of the usable range.
Thus, a load cell with a HI range of 10 % of the range will almost always have a LO range that is greater than 10 % or that of the high range.
By normalizing LLF to the maximum applied force of each range, we evaluate performance relative to how the range is actually used. This allows a fair comparison between LO and HI ranges, regardless of their vastly different capacities.
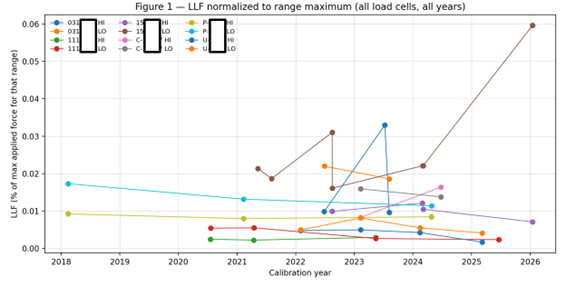
Figure 1. LLF normalized to the maximum applied force for each calibrated range (all load cells, all years).
Across the full dataset, LO-range points consistently sit above HI-range points once normalized.
By “usable margin,” we mean the portion of the calibrated range between zero load and the ASTM E74 verified lower force limit. Because the lower force limit is calculated as 400 × LLF (for Class A), a higher LLF directly raises the minimum verified usable force.
When LLF%Max is higher, the verified lower limit moves upward as a percentage of capacity. That reduces how much of the low end of the range can be used while still meeting the required class. In practical terms, less of the calibrated span remains available for verified measurement.
4.2 Scatter about the fitted curve (standard deviation)
ASTM E74’s LLF is driven by scatter about the fitted curve. Figure 2 plots the standard deviation of the residuals (Residual = Applied Force − Calculated Force (from the fitted curve) which are normalized to the HI Range Max lbf. Because these residuals are what the LLF is built from, this plot is a direct view of repeatability/consistency behavior in each range.
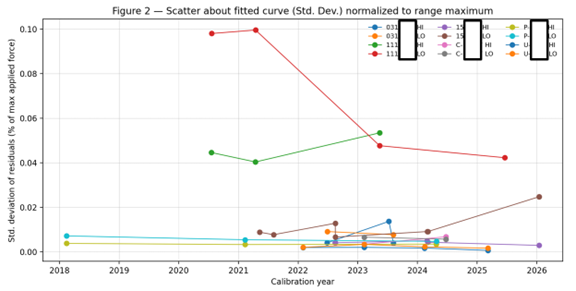
Figure 2. Scatter about the fitted curve (standard deviation), normalized to the maximum applied force for each range.
The same pattern is visible here: LO range generally exhibits higher normalized scatter than HI range across the different load cells and years.
4.3 Overall stability comparison (LO vs HI)
To summarize stability across all instruments, Figure 3 compares the distribution of normalized LLF values for LO vs HI ranges. A narrower distribution indicates more stable, repeatable behavior across calibrations.
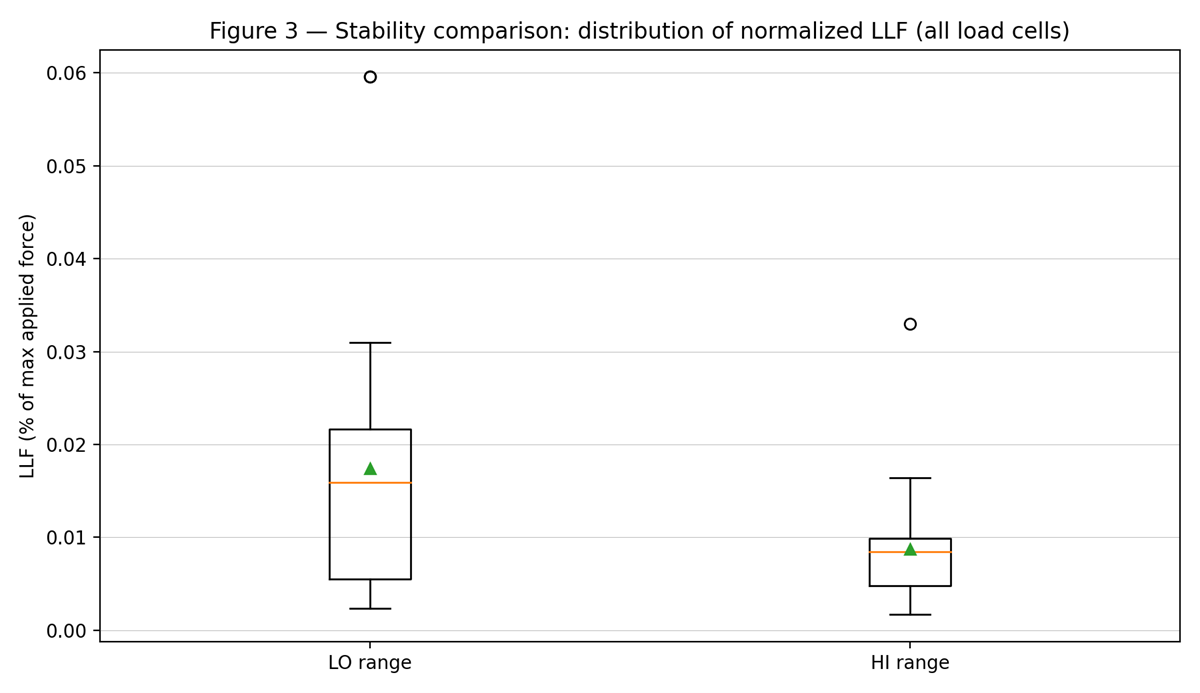
Figure 3. Overall stability comparison: distribution of normalized LLF for LO vs HI ranges.
The HI-range distribution is tighter and lower than the LO-range distribution in the aggregate. This matches what we observe in the time-series plots: HI ranges are typically more stable over time on a normalized basis.
5. What This Means Under ASTM E74 Stability Expectations
ASTM E74 emphasizes that devices should be calibrated at defined intervals to evaluate stability. In practical terms, stability is assessed by how repeatable the residual behavior is from one calibration to the next, and therefore how consistent LLF remains over time for a given range.
Using the complete dataset, the practical ASTM-style takeaway is:
• HI ranges tend to maintain tighter normalized LLF bands across years.
• LO ranges tend to show larger normalized LLF and larger variation, which translates to a higher verified lower-force limit for a given class.
This does not necessarily mean a load cell is ‘bad’—it means the low-force operating window is more constrained and may require derating sooner(either more frequent calibrations to maintain the desired Class A verified range of forces, or raising the Class A verified range of forces to accommodate degraded performance).
6. Challenges of Low-Range Calibrations (what the data repeatedly shows)
Across all reviewed load cells (spanning max forces of 600 lbf up to 600,000 lbf), the LO range tends to show:
• Higher LLF%Max directly reduces the usable verified range. For example, a HI range with an LLF equal to 0.01 % of full scale results in a Class A lower force limit of approximately 4 % of capacity (400 × LLF). If the LO range has an LLF greater than 0.02 % of full scale, the Class A lower force limit becomes greater than 8 % of capacity. In practical terms, doubling the normalized LLF doubles the minimum verified usable force.
• Higher StdDev%Max (more scatter about the curve)
• Larger year-to-year movement
In certificate terms, this shows up as a higher verified lower force limit for a target class and less stable low-force performance over time.
7. Dual-Range vs. Dedicated Load Cell: What Users Gain and What They Sacrifice
7.1 Why users choose dual-range HI/LO calibration (one load cell)
Users choose dual-range calibration because it simplifies real work:
• One sensor covers more of the force envelope
- Fewer changeovers and less fixturing (this may reduce timing errors from having to switch the reference standard).
- Faster setups and fewer opportunities to introduce setup variability
• Reduced calibration inventory and logistics
7.2 What you sacrifice (and what the certificates show you’re trading away)
Compared with using two dedicated load cells (one optimized for low forces and one for high forces), the trade-offs seen in the data are:
• Reduced low-force stability (LO normalized LLF is higher and more variable)
• Higher low-force scatter about the fitted curve (StdDev%Max trends higher)
• Earlier need to derate or restrict the LO range to meet a given ASTM class
In simple terms: you’re trading low-force performance margin for convenience and coverage.
7.3 Why you might NOT choose dual-range (choose two sensors instead)
If low-force performance is critical—tight acceptance bands, small-force threshold detection, or long-term stability at the bottom end—two dedicated sensors often make sense:
• A smaller-capacity sensor used only at low force typically shows better normalized performance in that regime.
• The high-capacity sensor remains available for large-force work without compromising the low-force requirement.
The cost is additional equipment, additional calibration cost, and more setup complexity.
8. Practical Decision Guide
Dual-range HI/LO calibration is usually a good choice when:
• The application tolerates a higher low-force verified limit (Some ASTM E4 calibrations)
• Setup speed and simplicity matter
• The low-force region is used for trending or screening rather than tight-acceptance measurements
Two sensors are often the better choice when:
• Low-force uncertainty/stability is a primary requirement
• The test relies on small-force changes
- The indicator doesn’t have enough resolution to gain any benefit from a LO range
• You need long-term stability at the bottom end with minimal derating risk
Bottom line: dual-range calibration is often the right operational choice when reduced setups are a priority. If the low end is critical (tight acceptance limits, small-force changes, or long-term stability demands), the data strongly supports using a dedicated low-capacity sensor for that portion of the work.
Dual-Range vs. Dedicated Load Cell
Across the sampled load cells and capacities, the certificates repeatedly show:
• LO range LLF is usually smaller in lbf, but higher once normalized to how the range is used. (For example, On a 10,000 lbf load cell the high range LLF could be 1 lbf, Class A = 400 lbf, and the low range 0.2 lbf, Class A = 80 lbf. Thus the HI range would be 0.01 % of FS, and the LO range 0.02 % of FS)
• LO range scatter about the fitted curve (normalized) is typically higher and varies more year-to-year.
• HI range tends to always have tighter normalized LLF bands and better repeatability.
Note: Changing polynomial order or recalibration can refine the curve fit, but it does not remove low-range scatter when the system’s repeatability is the limiter.
Highlights from the sampled load cells (what repeats across many years)
Figure 4 translates LLF into the practical question users care about: “How far down can I go and still claim a verified Class A range?” Across the sampled load cells, LO ranges generally imply a higher minimum usable force (as a percent of range max) than HI ranges. In other words, the low range tends to lose verified usable margin sooner.
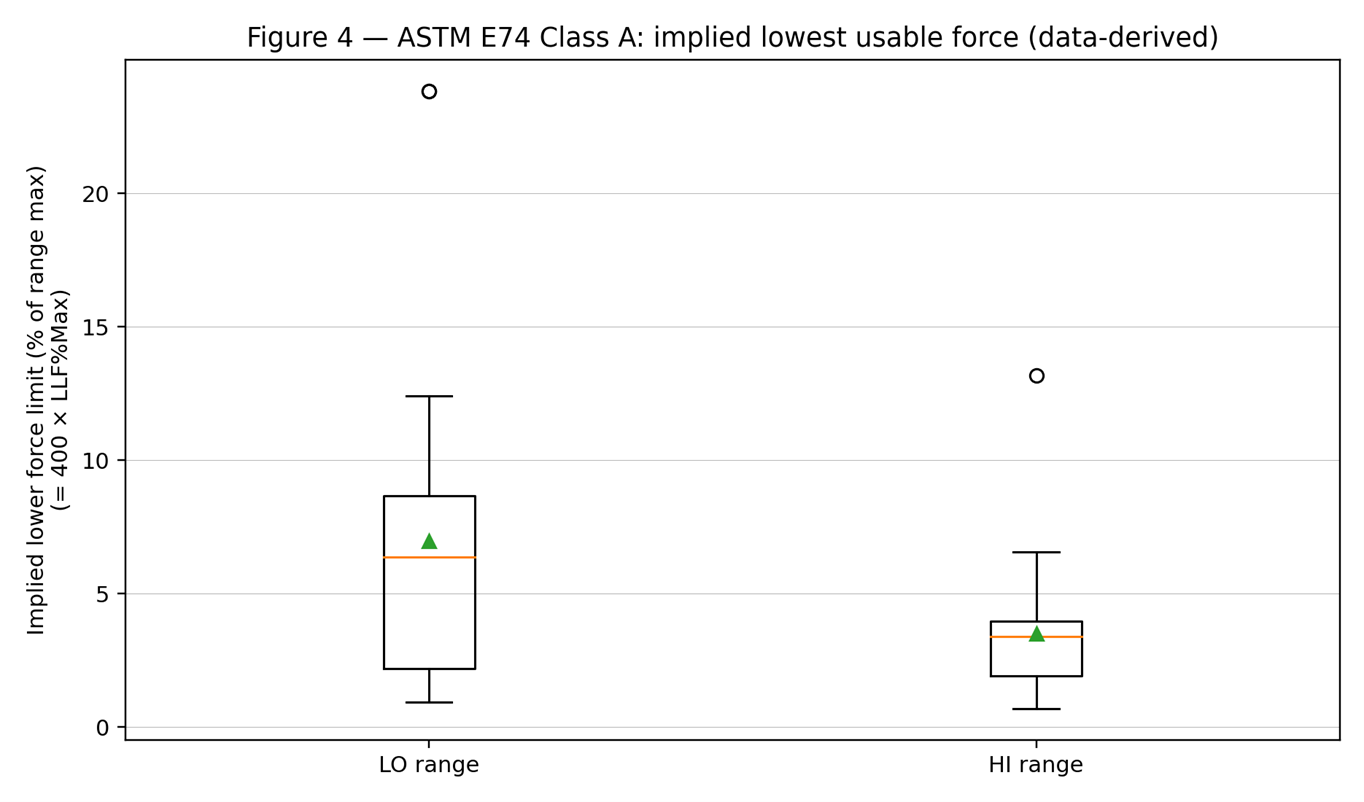
Figure 4. ASTM E74 Class A implied lowest usable force as a percent of each range’s maximum applied force (computed as 400 × LLF%Max).
ASTM E74’s LLF is a statistical summary of how tightly the calibration points repeat about the fitted curve. For Class A verification, ASTM E74 uses a simple rule: the lower force limit is 400 × LLF (in force units). That means any increase in LLF—especially in the low range—pushes the verified minimum usable force upward.
What ASTM E74 implies at the low end (in plain language)
1) Resolution and noise floor. At low forces, a fixed resolution or small random variation consumes a larger fraction of the applied force. That shows up directly as larger normalized scatter and a higher normalized LLF.
2) Stability over the calibration interval. ASTM E74 ties usability to whether the system holds calibration values over time. Low-range performance typically changes sooner and more noticeably than high-range performance.
3) The verified lowest usable force point. Both ISO 376 and ASTM E74 recommend avoiding extremely low percentages of capacity; ASTM E74 also provides a direct way to compute the verified lower limit for a class from LLF.
Top 3 considerations when deciding “how low” to go
This short update is based on sampling several dual-range (HI/LO) load cells across multiple capacities and years. The goal is simple: when a customer asks to use one load cell “for everything,” what do the calibration certificates say we can realistically expect at the low end?
It’s common for organizations to push equipment toward the lowest possible operating point to reduce inventory and setup time. Fewer sensors, fewer setups, and fewer calibrations is an attractive goal. The data in this paper shows that the trade is real: convenience usually comes with reduced low-force performance margin and reduced stability.
- Resolution and Noise Floor
At low forces, small effects become large as a percentage of the applied load. Resolution of the readout, electrical noise, and mechanical seating effects consume a greater fraction of the signal.
Even when absolute deviations are small, they represent a larger percentage of applied force at 2 % than at 20 %. This shows up directly in higher normalized LLF and higher normalized scatter.
Low-force performance is often limited not by curve fit, but by repeatability.
- Verified Lower Force Limit (ASTM E74 Impact)
ASTM E74 ties usability to repeatability through the Lower Limit Factor (LLF). For Class A verification:
Lower Force Limit = 400 × LLF (in force units)
This means that as LLF increases, the verified minimum usable force increases quickly.
If LLF is 0.01 % of full scale, the Class A minimum is about 4 % of capacity.
If LLF is 0.02 % of full scale, the minimum becomes about 8 % of capacity.
The multi-load-cell sample consistently shows that LO ranges tend to have higher normalized LLF than HI ranges, meaning the verified usable low end is often higher than users expect.
- Stability Over the Calibration Interval
Low-range performance is typically less stable over time.
Across multiple load cells and years, the data shows:
- LO ranges vary more year-to-year.
- Drift appears in the LO range before it appears in the HI range.
- Small shifts can push the load cell outside ASTM E74 stability criteria, shortening the calibration interval.
Even if a load cell performs acceptably at 2 % today, maintaining that performance over a two-year interval may be significantly more difficult.
Bottom line for one load cell
- If your low end is for calibrations with higher tolerances, such as 1 % of applied force, a single dual-range load cell can be a smart operational choice (fewer setups, fewer sensors).
- If your low end is critical (tight acceptance limits, small-force changes, long calibration intervals), the sample supports using two sensors: a dedicated low-capacity load cell for the bottom end, and a higher-capacity one for the top end.
About Morehouse
We believe in changing how people think about Force and Torque calibration in everything we do, including discussions on choosing between a dual-range vs. dedicated load cell.
This includes setting expectations and challenging the "just calibrate it" mentality by educating our customers on what matters and what may cause significant errors.
We focus on reducing these errors and making our products simple and user-friendly.
This means your instruments will pass calibration more often and produce more precise measurements, giving you the confidence to focus on your business.
Companies around the globe rely on Morehouse for accuracy and speed.
Our measurement uncertainties are 10-50 times lower than the competition, providing you with more accuracy and precision in force measurement.
We turn around your equipment in 7-10 business days so you can return to work quickly and save money.
When you choose Morehouse, you're not just paying for a calibration service or a load cell.
You're investing in peace of mind, knowing your equipment is calibrated accurately and on time.
Through Great People, Great Leaders, and Great Equipment, we empower organizations to make Better Measurements that enhance quality, reduce risk, and drive innovation.
With over a century of experience, we're committed to raising industry standards, fostering collaboration, helping with understanding risk, and delivering exceptional calibration solutions that build a safer, more accurate future.
Contact Morehouse at info@mhforce.com to learn more about our calibration services and load cell products.
Email us if you ever want to chat or have questions about a blog.
We love talking about this stuff. We have many more topics other than dual-range vs. dedicated load cells.
Our YouTube channel has videos on various force and torque calibration topics here.
# Dual-Range vs. Dedicated Load Cell

