

Why Your Calibration Lab's Uncertainty Number Is Costing You Money (And Risk You Don't Know About And How to Reduce Calibration Uncertainty)
How measurement uncertainty drives false accept and false reject decisions, and why it matters for your quality system.
If you've ever had a perfectly good instrument fail calibration, or worse, had a bad one pass, you've experienced the real-world consequences of measurement uncertainty. Most people treat uncertainty as a bureaucratic footnote on a calibration certificate. It's not. It's the single most important number for understanding whether your pass/fail decisions actually mean anything.
Let's break down what's really happening.
Why Your Calibration Lab's Uncertainty Number Is Costing You Money (And Risk You Don't Know About And How to Reduce Calibration Uncertainty) Intro -
The Two Errors Nobody Talks About Enough
Every pass/fail decision in calibration carries two potential errors:
Probability of False Accept (PFA) — also called Consumer's Risk is the chance that an out-of-specification instrument gets measured as in spec and passes. You accept something you should have rejected. That instrument goes back into service, makes measurements, and introduces errors downstream. Nobody knows. The consequences can range from minor product variation to safety failures, depending on your application.
Probability of False Reject (PFR) — also called Producer's Risk is the opposite: a perfectly good instrument gets measured as out of spec and fails. You reject something you should have accepted. This one hits you in the wallet. The instrument gets pulled from service, sent for adjustment or repair, or replaced, none of which was actually necessary.
Both errors cost you. PFA costs you quality and risk. PFR costs you time, money, and operational disruption. The frustrating thing is that they're linked if you try to reduce one without doing anything about uncertainty, you tend to increase the other.
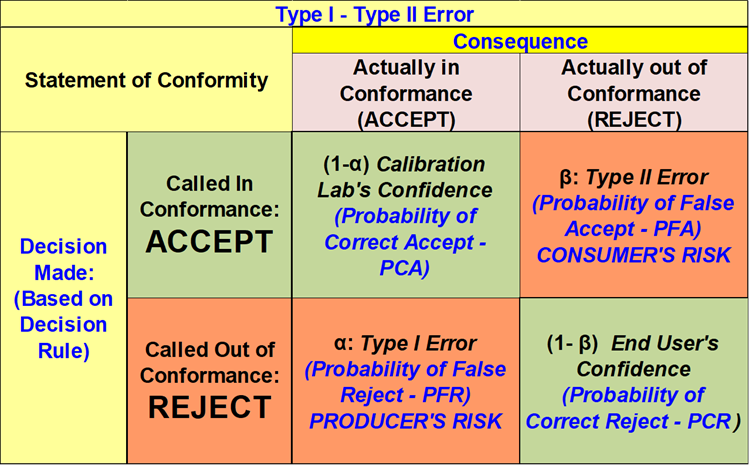
Figure 1 Courtesy of Dilip Shah
And what it all actually means
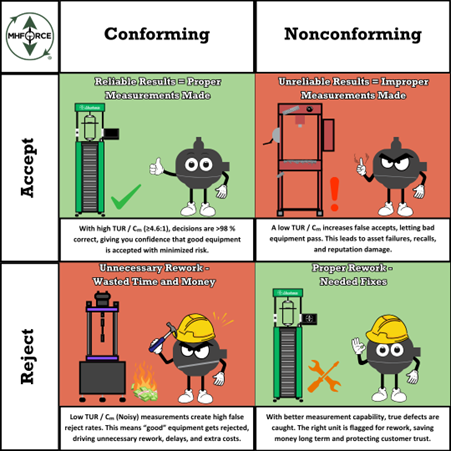
Figure 2 A Cartoon of What Happens in These Quadrants.
The two charts below show the same instrument calibrated at two different labs. The only difference is measurement uncertainty. Notice how the wide bell curve on the left bleeds past the spec limits in both directions, creating meaningful PFA and PFR risk. The narrow curve on the right stays well within the limits. Same spec. Same instrument. Completely different risk picture.
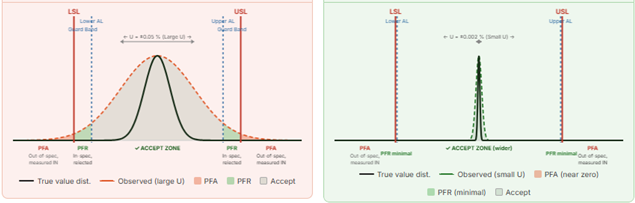
Figure 3: Example of PFA and PFR in Practice
Where Does Uncertainty Come into This?
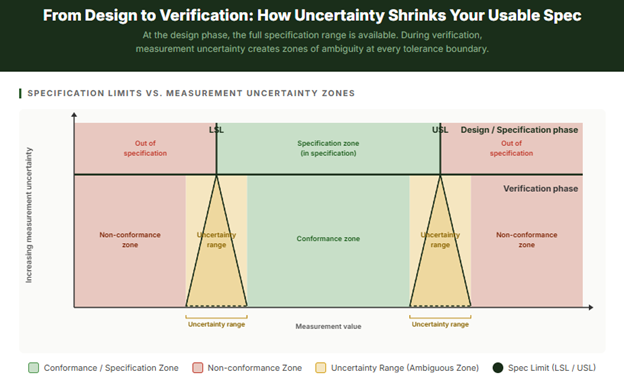
Figure 4. What Uncertainty Does to Conformance.
This graphic illustrates a fundamental problem in metrology: what you specify on paper and what you can reliably verify in practice are not the same thing.
The Design / Specification Phase (top band)
When an engineer designs a product or process, they define a tolerance, a Lower Specification Limit (LSL) and an Upper Specification Limit (USL). At this stage, the boundary is assumed to be a sharp, clean line. Something is either in spec or it isn't. There is no ambiguity. The world is simple.
The Verification Phase (bottom band)
The moment you pick up a measurement instrument to check whether something actually meets that specification, reality gets complicated. Your measurement tool has uncertainty; it doesn't tell you the exact true value, it gives you an estimate with a range of possible error around it. That uncertainty is represented by the triangles: a single sharp spec limit at the top fans out into a fuzzy zone at the bottom.
The Uncertainty Range (amber zones)
This is the critical insight the graphic is communicating. Near each spec limit, there is a band of measurement values where you genuinely cannot tell based on the measurement alone whether the item is truly in spec or truly out of spec. If your measurement falls within this zone, the true value could lie on either side of the limit. The wider your measurement uncertainty, the wider these amber zones become, and the more of your usable specification range gets consumed by ambiguity.
What this means practically
You face three distinct regions in the verification phase, not two:
- Non-conformance zone — far enough outside the limit that even accounting for uncertainty, the item is almost certainly bad. Reject with confidence.
- Uncertainty range — close enough to the limit that you cannot reliably determine conformance. This is where false accepts (PFA) and false rejects (PFR) happen.
- Conformance zone — far enough inside the spec that even accounting for uncertainty, the item is almost certainly good. Accept with confidence.
The practical consequence
If your measurement uncertainty is large relative to your tolerance, the amber zones eat up a significant portion of your specification range. Your "safe" conformance zone shrinks. You're forced to either accept more risk (by ignoring the uncertainty) or tighten your effective acceptance limits, which means rejecting more borderline-good parts and increasing cost.
In most practical calibration programs, the most direct way to recover usable specification range without increasing decision risk is to reduce measurement uncertainty at the source. That is precisely what a lower uncertainty calibration lab like Morehouse delivers, keeping those amber zones narrow so your full specification range remains usable, and your pass/fail decisions actually mean something.
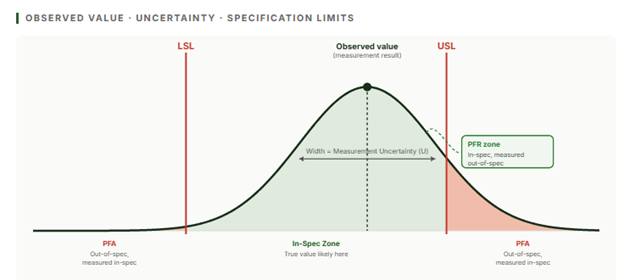
Figure 5 A Normal Distribution (Bell-Curve) with PFA and PFR.
Picture the measurement result as a probability distribution, a bell curve centered on the observed value. The width of that bell curve is your measurement uncertainty. It represents your ignorance about where the true value actually lies.
When that bell curve is wide (high uncertainty), the tails of the distribution extend well past the specification limits. That means:
- A measurement result that looks in spec might have a true value that's actually outside the limit that's PFA.
- A measurement result that looks out of spec might have a true value that's comfortably inside the limit that's PFR.
When the bell curve is narrow (low uncertainty), the tails barely reach the spec limits. The measurement result is much more likely to mean what it says. PFA drops. PFR drops provided guard bands are recalculated to reflect the new, lower uncertainty.
Your pass/fail decisions start meaning what they say. Your pass/fail decisions start meaning what they say. Yet not all risk is the same. There are two distinct ways to think about it, depending on whether you are evaluating a population of instruments or a single result in front of you right now.
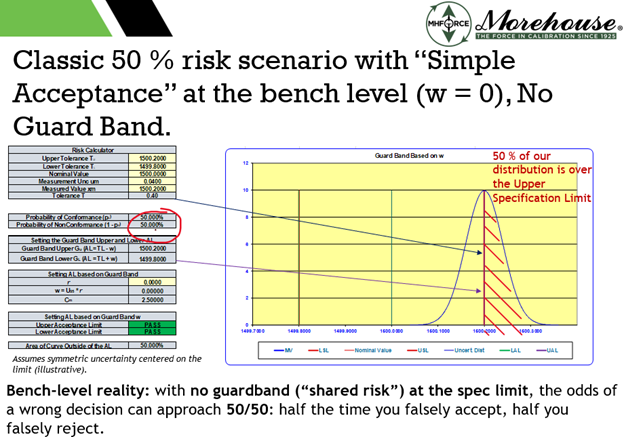
Figure 6. Example of boundary-case conditional risk under simple acceptance (illustrative ~50% at the limit under symmetric assumptions).
This is not a subtle effect. Under a simple acceptance (zero guard band) decision rule, if you assume a symmetric error model (often approximated as normal) and meagre prior information, a measurement result reported exactly at the tolerance limit implies an approximately 50% conditional probability that the true value lies on either side of that limit. In other words, at the boundary the decision can be no better than a coin flip. Reducing uncertainty (or applying an appropriate guard band/decision rule) sharply reduces this conditional risk for results near the tolerance boundary.
Global Risk vs. Specific Risk: Two Different Questions
This is where calibration gets nuanced, and where a lot of quality systems fall short.
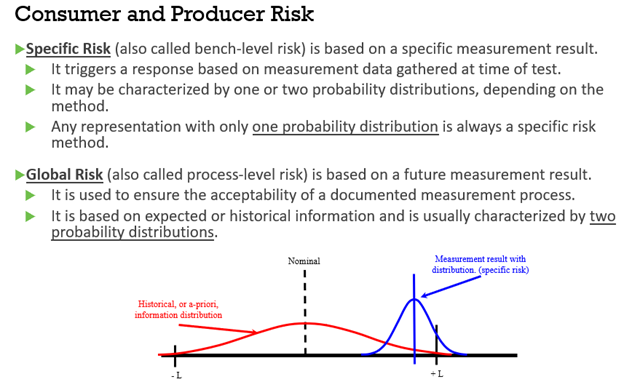
Figure 7: Global Versus Specific Risk Defined.
Global (Unconditional) Risk
Global PFA asks: "Across all the instruments we calibrate, what percentage of truly bad ones do we accept?"
This is an average across your whole population of instruments and calibration events. It depends on your historical reliability data. How often do instruments drift out of spec? and on the uncertainty of your calibration process. You have to know how your instruments behave over time to calculate them properly.
In programs that contractually invoke ANSI/NCSL Z540.3, a common target is controlling consumer’s risk (PFA) for acceptance decisions to ≤2 % under the specified decision rule (often framed as an unconditional/population-level requirement). Achieving an unconditional risk target generally requires not only a measurement uncertainty model but also a defensible model for the population of items being calibrated (i.e., prior information), which is often supported by reliability/interval data such as end-of-period condition (EOPR) or similar historical evidence. Where such data are limited, some Z540.3 handbook approaches use managed guard banding to control reported risk under stated assumptions, at the cost of increased false rejects, without claiming full population characterization.
The catch: an instrument that passes a 2 % global PFA requirement can still present much higher specific risk on individual measurements near the tolerance boundary. The global number is an average it masks what's happening at the edges.
Specific (Conditional) Risk
Specific PFA asks: "Given this particular measurement result, and given my uncertainty, what's the probability this specific instrument is actually out of spec?"
This is a conditional probability it depends on where the observed value landed relative to the tolerance limits. A result right in the middle of the tolerance range? Very low specific PFA. A result right at the edge of the acceptance limit? The specific PFA can be substantial, even if the global number looks fine.
Specific risk is the right framework when you don't have prior population data, what JCGM 106 calls 'meagre prior information,' or when a more cautious approach to false accepts is required, regardless of available data.
Guard Bands: The Balancing Mechanism
So how do labs manage the PFA/PFR trade-off in practice? With guard bands.
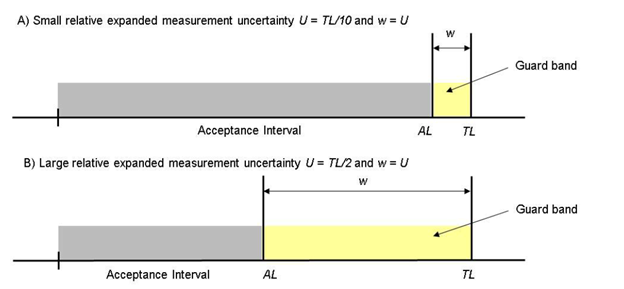
Figure 8: Image from ILAC G8 Showing Acceptence Zones with a Guard Band and Measurement Uncertainty.
A guard band is a buffer zone inside the specification limit. Instead of accepting any result that falls within the full spec range (LSL to USL), you only accept results that fall within a tighter acceptance limit (AL). The gap between the AL and the spec limit is the guard band.
Guard bands deliberately trade some PFR (you'll reject more borderline-good instruments) in order to reduce PFA (you'll accept fewer borderline-bad ones). The width of the guard band is set based on the measurement uncertainty and the desired maximum risk level.
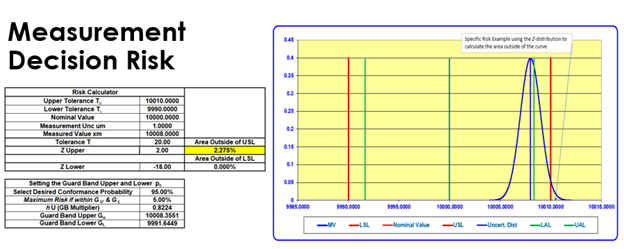
Figure 9: A Specific Risk Example of 2.275 % PFA.
One common conditional-risk guard band approach is to choose the acceptance limit so that, for a stated probability model (often normal) and stated uncertainty (u or U), the conditional probability of nonconformance at the acceptance boundary equals a chosen maximum consumer’s risk, α (one-sided). A convenient form is:
Acceptance limit = Spec limit − g·U, where U = k·u and g = Φ⁻¹(1−α)/k for a normal model (Φ⁻¹ is the inverse standard normal cumulative distribution function, CDF).
A simpler, more conservative rule (often associated with ILAC guidance) is to set Acceptance limit = Spec limit − U, which does not explicitly target α but generally reduces consumer’s risk at the expense of more false rejects.
Here's the key insight: the narrower your uncertainty, the narrower your guard band needs to be. With lower uncertainty, you can set tight guard bands without sacrificing much of the specification range, keeping PFR low while still controlling PFA. With large uncertainty, you either accept high PFA risk or apply wide guard bands that eat into your usable specification range and drive up false rejects.
An Important Clarification on what ISO/IEC 17025 Actually Requires
Note: It is worth being clear about what the standard does and does not mandate. ISO/IEC 17025:2017 requires that when a statement of conformity is made, the laboratory define and apply a decision rule that accounts for measurement uncertainty and considers the associated risk. It does not require guard bands, probability calculations, or any specific mathematical risk model.
Simple acceptance (a shared-risk decision rule with zero guard band), where a result is passed or failed purely on whether the reported value falls within the tolerance limits, may be used under ISO/IEC 17025, provided the decision rule is defined and (where applicable) agreed with the customer. The practical implication is that conditional consumer’s risk (PFA) for results close to a specification limit can be high. In the boundary case, depending on the assumed probability model and prior information, a result reported exactly at the limit can correspond to roughly 50% conditional probability of being on the nonconforming side. ISO/IEC 17025 does not mandate a specific guard band, but it does require that the decision rule and associated risk treatment be defined and applied.
Guard bands, probability-based decision rules, TUR requirements, and specific or global risk models are tools used to manage decision risk. They exist because the conditional risk near specification limits under shared-risk decision rules is often unacceptable in practice, especially when uncertainty is large relative to the tolerance.
If your calibration certificate shows a pass or fail with no mention of a decision rule or how uncertainty was accounted for, it is worth asking your lab which option they applied, because the answer has direct implications for how much you can trust that result.
What This Means in Practice
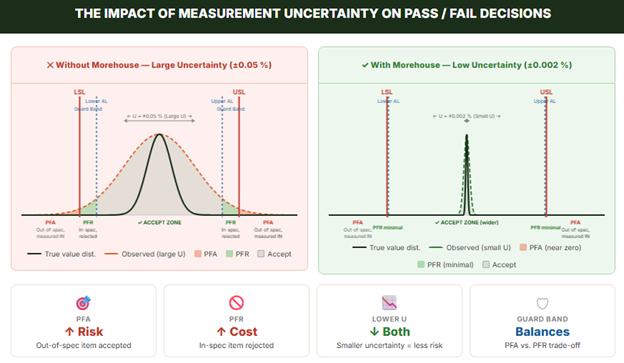
Figure 10: Why You Might Consider Using Morehouse for Force and Torque Measurements!
Let's make this concrete. Imagine you're calibrating a force measurement instrument with a ± 0.1 % of full-scale specification.
- Lab A (Not Morehouse) has measurement uncertainty of ±0.05 % (half the spec range). Their uncertainty distribution is wide relative to the tolerance. Any measurement near the spec limit carries meaningful PFA risk. They need wide guard bands, which means they're effectively only accepting instruments that fall within perhaps ±0.04 % of nominal, a much tighter window than the stated spec. Their false reject rate is high.
- Lab B (Morehouse) has measurement uncertainty of ±0.002 % (25x lower). Their uncertainty distribution is narrow. The result at the spec limit has a tiny tail past the boundary. Guard bands can be narrow. The full specification range is practically usable. False accepts are near zero. False rejects are minimal.
- Same instrument. Same specification. Completely different risk profiles driven entirely by the calibration lab's uncertainty.
Why This Matters for Your Quality System
If your calibration lab has high uncertainty, you face a choice that nobody usually makes explicit:
- Accept the PFA risk — pass/fail decisions near tolerance limits are unreliable, and some fraction of out-of-spec instruments are in service right now.
- Apply wide guard bands — increase your false reject rate and the associated costs.
- Reduce calibration intervals — catch drift more often. This can help, but interval adjustments should be grounded in reliability evidence (EOPR data where available, or other defensible historical/engineering information). Shortening intervals arbitrarily does not guarantee an unconditional (population-level) risk target is met and can add cost without a quantified benefit.
None of these is a great option. The better solution is to reduce the measurement uncertainty at the source by using a calibration lab with lower uncertainty.
For force and torque calibration specifically, the difference between a general-purpose lab and a specialist with primary deadweight standards can be 10–50× in uncertainty. That's not a marginal improvement. That's the difference between a quality system that's actually working and one that's generating paperwork while hoping for the best.
The Bottom Line
Measurement uncertainty isn't just a number on a certificate. It's a direct driver of how many bad instruments you accept into service and how many good ones you unnecessarily reject. Both have real costs. One shows up in quality and risk. The other shows up in your budget.
Understanding PFA and PFR, the difference between global and specific risk, and how guard bands work gives you the tools to have an intelligent conversation with your calibration provider about whether their uncertainty is actually fit for your purpose.
The next time you get a calibration certificate, don't just check the pass/fail result. Look at the uncertainty. Then ask yourself: given where that measurement landed relative to my tolerance, what's the actual probability it's telling me the truth?
Why Your Calibration Lab's Uncertainty Number Is Costing You Money (And Risk You Don't Know About And How to Reduce Calibration Uncertainty)
About Morehouse
We believe in changing how people think about Force and Torque calibration in everything we do, including how to reduce calibration uncertainty.
This includes setting expectations and challenging the "just calibrate it" mentality by educating our customers on what matters and what may cause significant errors.
We focus on reducing these errors and making our products simple and user-friendly.
This means your instruments will pass calibration more often and produce more precise measurements, giving you the confidence to focus on your business.
Companies around the globe rely on Morehouse for accuracy and speed.
Our measurement uncertainties are 10-50 times lower than the competition, providing you with more accuracy and precision in force measurement.
We turn around your equipment in 7-10 business days so you can return to work quickly and save money.
When you choose Morehouse, you're not just paying for a calibration service or a load cell.
You're investing in peace of mind, knowing your equipment is calibrated accurately and on time.
Through Great People, Great Leaders, and Great Equipment, we empower organizations to make Better Measurements that enhance quality, reduce risk, and drive innovation.
With over a century of experience, we're committed to raising industry standards, fostering collaboration, helping with understanding risk, and delivering exceptional calibration solutions that build a safer, more accurate future.
Contact Morehouse at info@mhforce.com to learn more about our calibration services and load cell products.
Email us if you ever want to chat or have questions about a blog.
We love talking about this stuff. We have many more topics other than how to reduce calibration uncertainty.
Our YouTube channel has videos on various force and torque calibration topics here.
# how to reduce measurement uncertainty

