

Start With the End in Mind: Working Backwards to Size Your Measurement Equipment and Calibration Provider
A practical, risk-informed method for selecting equipment, decision rules, and calibration providers
Abstract
Begin with the decision you must defend—product conformance with acceptable risk—and work backwards to derive the measurement capability required of both your equipment and your calibration provider. Set explicit risk targets (e.g., unconditional Probability of False Accept (PFA) ≤ 2 %), choose a decision rule, and translate those targets into required Measurement Capability Index (Cm), also known as Test Uncertainty Ratio (TUR), and/or End-of-Period Reliability (EOPR). From there, pick equipment and a calibration lab that can deliver the necessary uncertainty, traceability, and decision rule implementation. This paper provides the steps, sizing rules of thumb, checklists, and purchase-order language to guide the process.

1. Start with the End in Mind
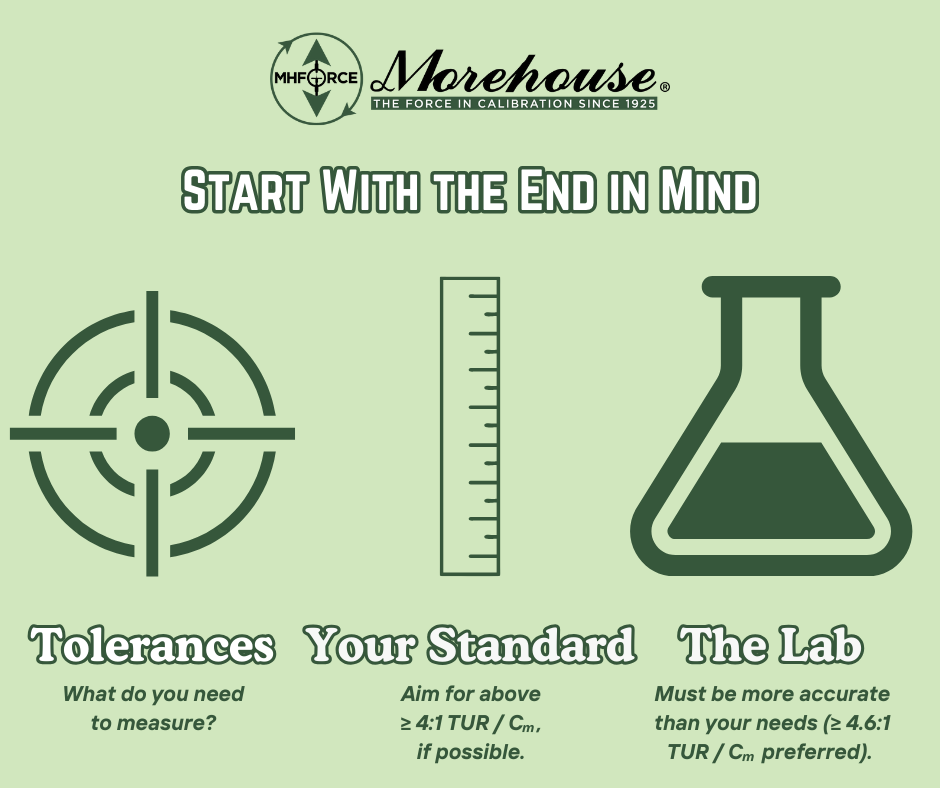
Ask two questions before any measurement or purchase:
- How good does the measurement need to be?
Business lens: What happens if we’re wrong—safety, regulatory exposure, recalls, warranty, lost uptime, scrap/rework? Which features are critical? What false-accept (consumer) and false-reject (producer) risks are acceptable? - How good can the measurement be made?
Technical lens: What can our process + equipment + provider actually deliver? Consider the uncertainty budget (reference standard, method, environment, operator, resolution, stability/drift) and how it behaves across the points where we’ll decide conformance.
Why this matters: Answering these two questions up front prevents buying the wrong tool, asking a lab to do the impossible, or making conformity decisions that don’t meet your risk tolerance.
Clarifying these up front prevents costly misalignment later.
Define the end state in operational terms:
- Decision to be made: accept/reject/adjust.
• Target decision risk: e.g., PFA ≤ 2 %, producer risk tolerable.
• Decision rule you may use: Subtracting U 95 % or another Specific Risk Decision Rule, or a more Global Decision Rule like M6.
• Applicable tolerances & environments. For Example: % of reading, % of full scale, or absolute units. - Required reporting: uncertainties (k = 2, or 3), U95 % or U99 % for what Confidence Interval and how it is calculated.
2. A Backward-Pass Method (from decision risk to capability)
Step A — Set the risk target and decision rule.
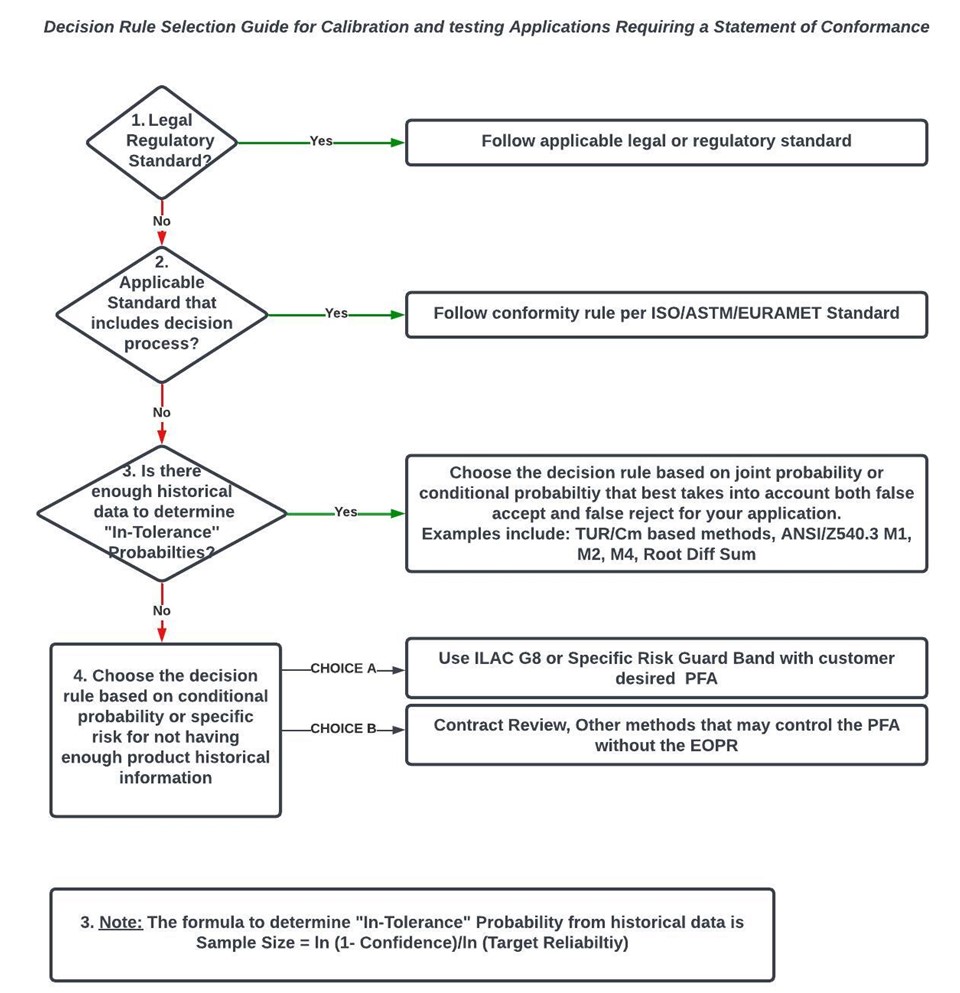
- Depending on the risk level and application, select an unconditional (Global based on averages), or conditional (Bench-Level, Specific) PFA target (e.g., ≤ 2 %). The decision tree above likely provides the appropriate guidance.
- Choose the appropriate decision rule: risk-limited guardband, subtracting 95 % of the MU, multi-state, Method 6, or other methods.
• State this in your purchase orders and calibration instructions.
Example: Calibrate XXX instrument, subtracting the 95 % Expanded Uncertainty. If PFA < 5 %, PASS; otherwise, FAIL.
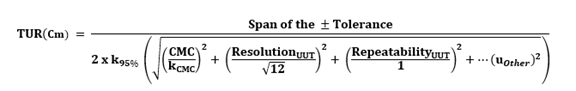
Step B — Convert risk target to required capability.
- Rule of thumb: With shared-risk (no guardband), a TUR ≥ 4.6:1 constrains unconditional PFA to ≤ 2%
- Alternatively, if End-of-Period Reliability (EOPR) ≥ 89% for like instruments, PFA ≤ 2% regardless of measurement uncertainty.
- If neither condition holds, apply guardbands sized to the chosen risk limit and recompute required TUR.Step C — Translate capability to equipment and provider requirements.
- Equipment: ensure the achievable expanded uncertainty Uexp satisfies Uexp ≤ Tolerance / 4.6 when operating without guardbands at PFA 2%.
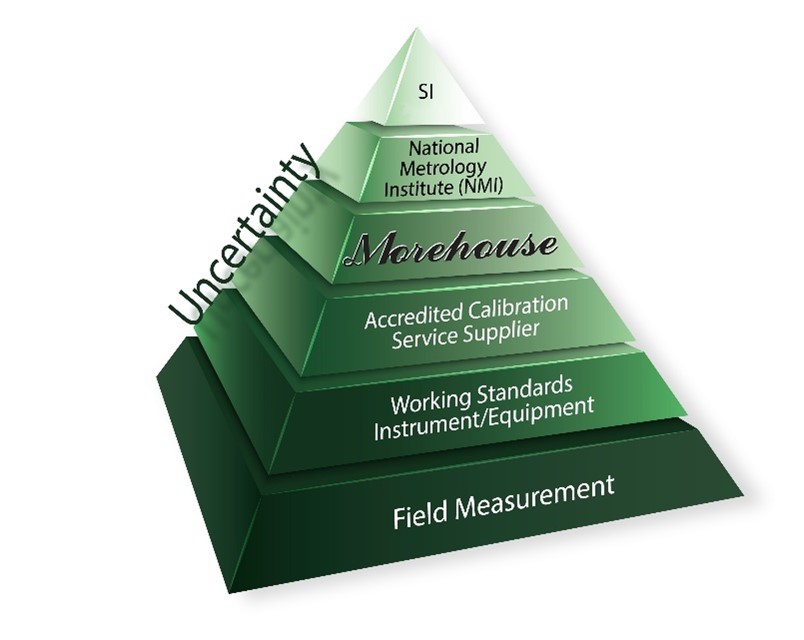
- Provider: require a lab that can demonstrate CMCs, methods, and decision rules consistent with your targets and provide traceability to SI.Step D — Validate with reliability data and control charts.
- Trend in-tolerance reliability by family of instruments; adjust intervals and guardbands accordingly.
- Maintain feedback loops when any out-of-tolerance condition is found.
3. Sizing Rules & Quick Math
| Device Tolerances You Need to Calibrate (T) | Required U (k = 2) | Resulting TUR/Cm | Global Risk Requirements |
| 0.01 % | 0.0022 % | 4.6:1 | PFA ≤ 2 % |
| 0.05 % | 0.0109 % | 4.6:1 | PFA ≤ 2% |
| 0.10 % | 0.0217 % | 4.6:1 | PFA ≤ 2 % |
| 0.50 % | 0.1087 % | 4.6:1 | PFA ≤ 2 % |
Example: For a tolerance of 0.10 % and shared-risk decisions, targeting PFA ≤ 2% implies Uexp ≤ 0.10% / 4.6 ≈ 0.0217 %. If your current process delivers Uexp = 0.033 %, you either (a) add guardbanding, (b) improve capability (equipment, method, environment), or (c) increase reliability (EOPR ≥ 89 %) and justify against the PFA model.
Note: You do not need to use 4.6:1, and in some cases, there will not be a standard that is 4.6 times better than what you wish to calibrate.
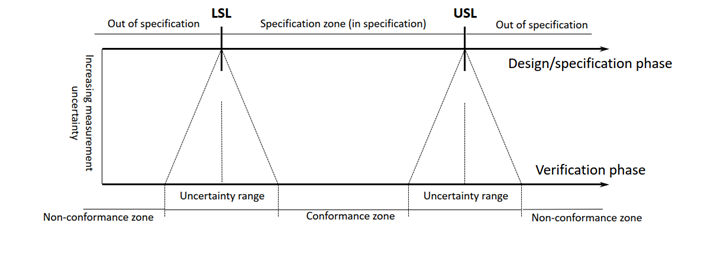
Every measurement we take comes with some level of doubt. This doubt is called measurement uncertainty. It’s the range within which the “true value” probably lies.
The larger the TUR/Cm ratio, the more room you will have to issue a “Pass” statement of conformity.
4. Equipment Selection: Uncertainty, Throughput, and Cost of Ownership
When comparing machines, look beyond sticker price to long-term costs: downtime for reference calibration, cycle time, risk of damage in shipping, and rework costs from false rejects. Higher capability reduces decision risk and often the total cost of ownership.
This example compares three force machines and the typical Calibration and Measurement Capability Uncertainty Parameter. The cost uses a hypothetical cost of $ 100.00 per hr and assumes 1,000 instruments are calibrated per year.
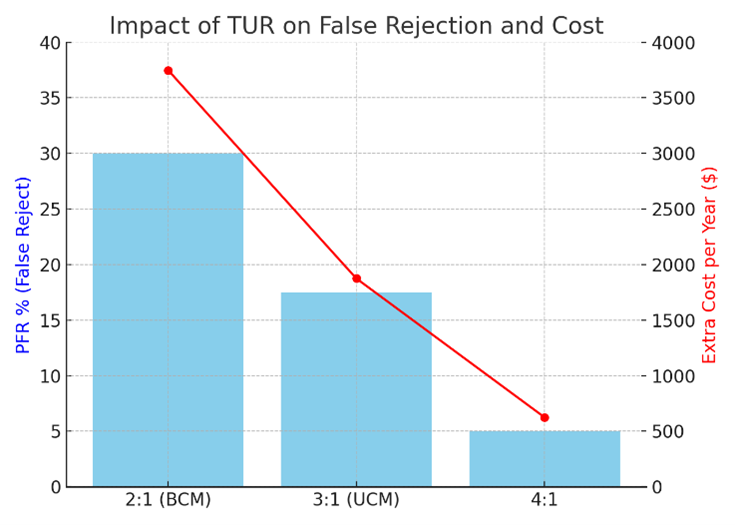
| Option | Approx. TUR/Cm | Decision Correctness / PFR | Rework Cost (1,000/year @ $50/0.5hr) |
| BCM | 2:1 | ~90–92% / ~9–10% | $4,500–$5,000 |
| UCM | 3:1 | ~95–96% / ~4–5% | $2,000–$2,500 |
| Deadweight | 50:1 | ~100% / ~0% | $0 |
Practical implication: paying more up front for greater capability can reduce rework and downtime enough to break even over time.
5. Calibration Provider Capability
Selection Criteria:
• The calibration provider demonstrates traceability via a documented, unbroken chain to the SI, with uncertainties at each tier.
• The calibration provider publishes CMCs appropriate to your needs and that can achieve the Uexp required by your target TUR.
• The calibration provider states the decision rule used and can apply guardbands sized to your risk target.
• The calibration provider provides EOPR trends or incorporates your reliability data to justify risk compliance.
• The calibration provider supports feedback analysis when their standards are found out-of-tolerance.
6. Lifecycle & Reliability Considerations
Risk exists across the lifecycle—research, design, test, and product assurance. Control measurement risk early to prevent expensive downstream consequences. Use reliability trending to set intervals and keep decision risk controlled without over-calibrating.
7. Implementation Checklist (Purchase Order / SOW Language for calibration provider)
1) Decision Rule & Risk: “Calibrate using a decision rule that constrains unconditional PFA to ≤ 2 %. If shared-risk, ensure TUR ≥ 4.6; otherwise apply guardbands sized to the target risk.”
2) Uncertainty & TUR: “Report expanded uncertainty (k = 2). Required Uexp ≤ T/4.6 unless guardbands are used.”
3) Traceability: “Provide metrological traceability statement showing an unbroken chain to the SI with uncertainties at each stage.”
4) Reliability: “Provide or accept EOPR data; adjust intervals to maintain target risk.”
5) Feedback: “Notify and perform impact analysis if any reference standard is found out-of-tolerance.”
Key Takeaways
- “ISO/IEC 17025 requires clear decision rules.”
- “Shared risk can mean up to 50 % false accepts.”
- “Aim for ≥ 4.6:1 TUR, if possible.”
- “High Measurement Uncertainty in Relationship to the Tolerance = High Risk!”
Method 6, aka Mike Dobbert, Method Formula
In late 2006, ANSI/NCSL Z540.3 added a Global consumer risk requirement of 2 % or less for calibrations requiring a conformance decision.
- Many calibration providers did not have the reliability data (EOPR) needed for Global Risk
In response, Michael Dobbert developed a Managed Risk Guardband that does not require EOPR.
Paul Reese and John Harben wrote a paper titled Risk Mitigation Strategies for Compliance Testing, which proved that for the worst-case EOPR, if the TUR was 4.6:1 or greater, the false accept risk would always be below 2 %. The formula is shown in Appendix B.
References (source summaries)
- Measurement Quality Assurance for End-Item Users (NASA): Begin-with-the-end approach; traceability and uncertainty fundamentals; two key questions on ‘how good does it need to be’ and ‘how good can it be made.’
- NASA HDBK 8739.19-4 Annex 4: Definitions and methods for PFA/FRR (UFAR/CFAR), bench-level vs process-level risk, guardbands, and compensating measures.
- Using Reliability to Meet Z540.3’s 2 % Rule: Engineering basis that TUR ≥ 4.6 or EOPR ≥ 89 % are sufficient for PFA ≤ 2%.
- NASA Risk Management Handbook: RIDM/CRM framework—set risk tolerance, make risk-informed choices, then manage residual risk.
- Metrology and the Consequences of Bad Measurements & Metrology’s Influence Across the Product Lifecycle: Direct/indirect risk, lifecycle impacts, and the importance of integrating metrology early.
Appendix A — Bench-Level vs. Global Risk Further Explained
NASA HDBK 8739.19-4 Annex 4 distinguishes between two levels of risk assessment:
• Bench-level (conditional) risk: the false accept/reject risk calculated for a single measurement decision at the bench.
• Global (unconditional) risk: the false accept risk across a population or fleet of instruments. This is the basis for Z540.3’s 2 % requirement.
Bench-level view (conditional risk, specific risk)
Imagine you are calibrating a single instrument on a bench. Based on the tolerance and measurement uncertainty, your analysis shows a Probability of False Accept (PFA) = 4 %. That means, if you only looked at this one decision in isolation, there’s a 4 % chance you would wrongly accept an out-of-tolerance item.
This is called conditional risk because it conditions on this one calibration event and the measurement result. Annex 4 of NASA HDBK 8739.19-4 often labels this CFAR (conditional false accept risk).
Fleet-level view (unconditional risk, global risk)
Now zoom out to the whole fleet of similar instruments. Say you track them with a reliability analysis and find that 89 % of instruments remain in tolerance until the end of their calibration cycle. That percentage is the End-of-Period Reliability (EOPR).
This fleet-level reliability directly limits how often an out-of-tolerance instrument even arrives at the bench. In statistical terms, it bounds the unconditional probability of false accept (UFAR) across the fleet. NASA and Z540.3 analyses show that when EOPR ≥ 89 %, the UFAR is guaranteed to be ≤ 2 %, even if some individual bench-level calculations show higher conditional risks.
Why the numbers differ
- At the bench: You only see that specific test, so the calculated PFA can be higher (e.g. 4 %).
- Across the fleet: Because most instruments are still good at the end of the interval (≥89 %), the average chance of a false accept across all instruments is much lower. That’s why the unconditional risk drops to ≤2 % overall.
Appendix B — Guardbanding Methods and Example
Guardbands shrink the acceptance region to cap risk. Annex 4 describes several methods; Method 6 is commonly applied:
A = T −U95 % × M
- A = acceptance limit
- T = tolerance limit
- U95 % = calibration process 95 % expanded uncertainty
- M = multiplier: the fraction of the 95 % expanded uncertainty for which the acceptance limits provide the desired false-accept risk.
M2 % = 1.04 – e((0.38 ln(Cm) – 0.54)
For example, with T = 0.10 %, Cm = 2.5, and U95 = 0.033 %, Method 6 produces M ≈ 0.74, so the guardband reduces the acceptance region by 0.024 %. This ensures unconditional PFA ≤ 2%.
Labs must report when guardbands are applied, and show guardbanded acceptance limits on the calibration certificate.
Appendix C — Dual Dominance Conditions
Two conditions are sufficient to guarantee unconditional PFA ≤ 2 %:
• Bench-level dominance: TUR ≥ 4.6 (uncertainty small enough).
• Global dominance: EOPR ≥ 89 % (fleet reliability high enough).
Either condition alone suffices. In practice, organizations often aim to satisfy both for extra assurance.
Appendix D — Reliability Trending Example
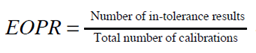
End-of-Period Reliability (EOPR) is the proportion of instruments remaining in tolerance at the end of the calibration interval.
Example: A lab finds 85 % of torque wrenches in-tolerance at 12 months. This yields EOPR = 85 %, which is below the 89 % threshold. By shortening the interval to 9 months, trending shows 91 % in-tolerance, restoring compliance. This demonstrates how interval adjustment controls risk when TUR ≥ 4.6 cannot be achieved.
Appendix E — Linking to RIDM and CRM
The NASA Risk Management Handbook describes two complementary disciplines:
• Risk-Informed Decision Making (RIDM): set risk tolerance, define alternatives, and make measurement system choices consistent with mission objectives.
• Continuous Risk Management (CRM): monitor reliability data, adjust calibration intervals, and apply guardbands to manage residual risk.
Backward-sizing is an example of RIDM, while reliability trending and interval control are CRM practices.
Appendix F — Lifecycle and Cost Impacts
Here’s what that looks like in practice:
| TUR | Correct Decision | PFR (False Reject) | Avg. Cost per Decision @ $50 ½ hr. |
| 2:1 | ~90–92 % | ~9–10 % | $4.50–$5.00 |
| 3:1 | ~95–96 % | ~4–5 % | $2.00–$2.50 |
| 50:1 | ~100 % | ≈0 % | ≈ $0.00 |
If you do 1,000 calibrations a year:
- The BCM (2:1) costs you about $5,000 annually in hidden rework.
- The UCM (3:1) cuts that to about $2,500 annually.
- The Deadweight (50:1) avoids that cost entirely.
So if a UCM costs $15,000 more than a BCM, rework savings alone cover that difference in ~6 years.
And if your devices require tighter tolerances (say 0.05 %):
- At 1:1 TUR, hidden rework costs jump to $17.50 per decision.
- At 1.5:1 TUR, that drops to ~$8.
- At 25:1 TUR, it’s essentially $0.
Metrology choices impact lifecycle costs with Morehouse Machines:
• A BCM (TUR 2:1) may appear cheaper, but leads to higher false reject rates (~9–10%), costing ~$5,000 per 1,000 calibrations in rework.
• A UCM (TUR 3:1) cuts false rejects in half (~4–5%), halving rework cost.
• Deadweight standards (TUR 50:1) virtually eliminate false rejects, saving long-term costs despite higher upfront price.
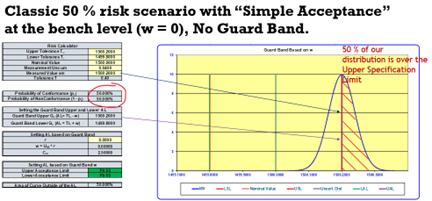
Appendix G — Shared Risk
Several in the industry often take a "shared risk" approach, and some disguise this by stating a Guardband of w=0 has been applied. What that phrase means is that NO Guardband has been applied.
What "shared risk" means is as long as the measured value is less than or equal to the tolerance, the value is reported. It is agreed upon as being in conformance, though many are not applying a Guardband (w=0) and taking the approach that the end-user can decide if it is in or out of conformance.
ISO/IEC 17025:2017 Clause 7.1.3 dictates that the customer must agree upon the decision rule when a statement of conformity is to be made. The customer shall specify the acceptance criteria for conformity. The decision rule(s) requirement is unnecessary if no conformance criteria is specified.
Simply put, regarding decision rules, if you choose not to decide, you still have made a choice (Shared Risk).
Under this scenario, the consumer accepts the risk of up to 50 % Probability of False Accept (PFA). If the UUT propagates measurement uncertainty further without corrected known biases, a PFA higher than 50 % is more likely to occur.
Thus, as a customer, you could have a much higher level of Risk than you wanted.
More Information about Morehouse
We believe in changing how people think about Force and Torque calibration in everything we do, including discussions on force calibration procedures.
This includes setting expectations and challenging the "just calibrate it" mentality by educating our customers on what matters and what may cause significant errors.
We focus on reducing these errors and making our products simple and user-friendly.
This means your instruments will pass calibration more often and produce more precise measurements, giving you the confidence to focus on your business.
Companies around the globe rely on Morehouse for accuracy and speed.
Our measurement uncertainties are 10-50 times lower than the competition, providing you with more accuracy and precision in force measurement.
We are a calibration provider that can turn around your equipment in 7-10 business days so you can return to work quickly and save money.
When you choose Morehouse, you're not just paying for a calibration service or a load cell.
You're investing in peace of mind, knowing your equipment is calibrated accurately and on time.
Through Great People, Great Leaders, and Great Equipment, we empower organizations to make Better Measurements that enhance quality, reduce risk, and drive innovation.
With over a century of experience, we're committed to raising industry standards, fostering collaboration, and delivering exceptional calibration solutions that build a safer, more accurate future.
Contact Morehouse at info@mhforce.com to learn more about our calibration services and load cell products.
Email us if you ever want to chat or have questions about a blog.
We love talking about this stuff. We have many more topics other than expressing SI units!
Our YouTube channel has videos on various force and torque calibration topics here.
#calibration provider

