

Same Data, Four Answers: What the JCGM’s New Torque Example Teaches Us About Calibration Curve Fitting
Eight torque points. One straight line. Four defensible answers.
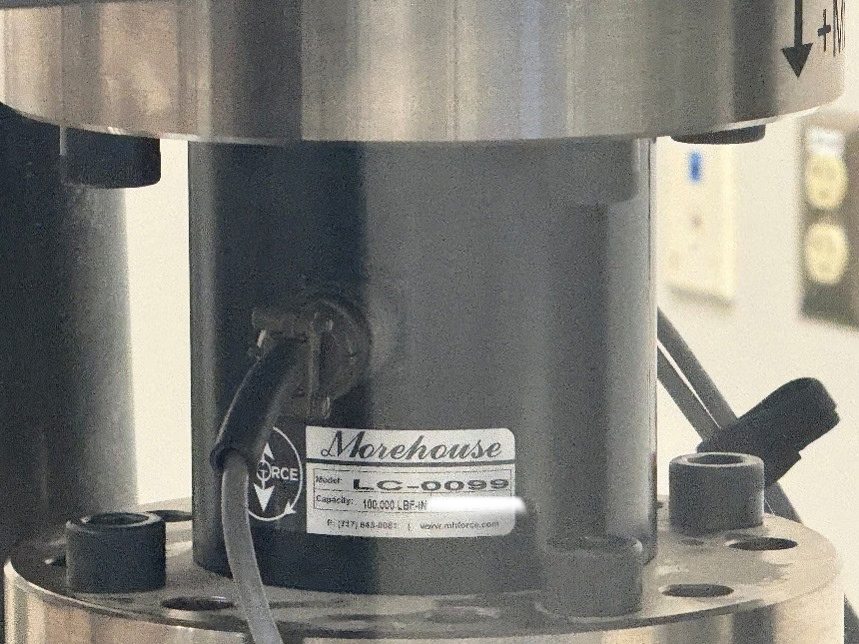
Figure 1A close-up of a torque cell being used in a Morehouse torque transfer machine
That is the punchline of Example 9 in JCGM GUM-5:2026, the new examples volume in the GUM suite. A torque-measuring sensor is calibrated against a reference system, a straight line through zero is fitted to the data, and the JCGM works the same eight points four different ways. The slope comes out anywhere from 1.0085 to 1.0107, and the standard uncertainty ranges from 0.0008 to 0.0015, nearly a factor of two, before anyone touches a transducer, changes a reference, or adjusts a single reading. Same lab, same data, same physics. The only thing that changed was the math applied to the fit.
Which answer goes on the certificate? Which one survives an audit? Which one is the correct one, and is this what your software is choosing for you right now?
That is what this example is really about, and it is worth every technician’s time, because calibration curve fitting is not paperwork that happens after the measurement. The curve fit is part of the measurement.
The setup
The example is not original to GUM-5. It was contributed from the EMPIR 17NRM05 compendium of uncertainty examples (EMUE), worked up by Sascha Martens, Katy Klauenberg, and Clemens Elster of PTB, Germany's national metrology institute, and the underlying data come from example B2 of the German guideline VDI/VDE 2600 Part 2: a torque sensor read against a reference at eight torque levels from 0.101 N·m to 5.007 N·m, with six repeated readings at each level (only three at the top point). The model is the simplest one in the book, a straight line through zero, Y = βX, where the slope β is the measurand.
A word on PTB, since they wrote the example. In my opinion they can be the best torque laboratory on the planet. We send our torque transducers there when their machines are up and running, and that is the one catch: the larger machines carry a heavy maintenance load and go down often. They also publish some of the best torque literature anyone puts out, and they publish it for free. Same bat time, same bat channel. Back to the data.
Here is the detail that drives everything: the scatter of the repeated readings is not the same across the range. The standard deviation runs from 0.0041 N·m at mid-range to 0.0379 N·m at the top point. That is nearly an order of magnitude of difference in variability, and the noisiest point is also the one with the fewest repeats. If that pattern sounds familiar, it should. Real force and torque data behave exactly this way.
Four methods, four results

Look at what ordinary least squares does. It treats every point as equally trustworthy even though the variability differs by an order of magnitude, so the noisy top point drags the slope around like an anchor. Worse, the effective degrees of freedom collapse to 2.7, which means the coverage factor swells well past 3 and the 95 % interval becomes the widest of the four by a comfortable margin.
Weighted least squares fixes the trust problem by weighting each point by the inverse of its variance. The uncertainty drops nearly in half, the effective degrees of freedom climb to 14, and the slope moves by roughly 0.2 %, which in this example is more than the uncertainty itself.
Simple, right? Just weight the data.
I sit on ASTM Committee E28, and I can tell you there are a lot of smart people there who would like to see methods other than least squares in the force and torque standards. That conversation is live.
Not quite. The weights come from the observed standard deviations, and standard deviations estimated from six readings (or three, at the noisy top point) are themselves shaky. Trusting them completely is its own leap of faith. That is why the JCGM works the problem a third way: Bayesian inference estimates the slope and the point-by-point variabilities simultaneously, instead of freezing imperfect weights and pretending they are exact. Both Bayesian runs land between OLS and WLS, at 1.0091 to 1.0092 with standard uncertainties of 0.0009 to 0.0011, and GUM-5 recommends the Bayesian analysis for this case.
What calibration curve fitting means at your bench
If you calibrate to ASTM E74 for force or ASTM E2428 for torque, you do not get to pick your regression, and Example 9 is the clearest explanation yet of why that is a feature. The standards prescribe a method-of-least-squares polynomial fit precisely so that every laboratory computes the same answer from the same data, and they wrap the fit’s error in a standardized statistic, the lower limit factor (LLF), so the fit’s contribution shows up in your uncertainty budget instead of hiding in a software default. I cover the mechanics in the e-book chapters Calculating Coefficients Used in Polynomial Equations, How to Calculate the Polynomial Force Equation, and Coefficients Explained.
The heteroscedasticity lesson is the one to carry home. Say it out loud, and it sounds like something a candidate gets accused of in one of those political advertisements as being pro or against, doesn’t it? It is just scatter that changes across the range. Variability that changes across the range is not a statistical curiosity; it is the daily reality of the low end of every load cell and torque transducer, where resolution and the noise floor take over. It is a reason the e-book devotes a chapter to How Low Can My Load Cell Go?, parts of which ran in Cal Lab magazine, and the reason ASTM E74 limits the verified range to 400 times the LLF for Class A and 2 000 times for Class AA rather than letting a pretty fit imply performance the instrument cannot deliver at 1 % of capacity.
And the replication lesson hides in plain sight: the noisiest torque level carried only three repeats. Thin replication exactly where scatter is largest is how uncertainty statements go soft. If your loading schedule collects the fewest readings at the points that misbehave the most, the fit will happily reward your optimism. The chapters on the repeatability and reproducibility conditions of measurement show how to build schedules that do not. Standardization of the ending zero reduction method is also where I have an open proposal in front of ASTM for both E74 and E2428. More on that in a moment.
ASTM Method B: same data, three zeros, three answers
The GUM committee needed four regressions to make its point.
Both E74 and E2428 give you two ways to treat zero. Method (a) subtracts the initial zero reading and nothing else. Method (b) uses zero readings taken before and after loading, and when a series of forces or torques is applied before the return to zero, both standards permit interpolated zero indications for the points in between. Neither standard, as published in 2026, says how to interpolate. That silence looks harmless. It is not.
Take an eleven-point calibration of a 25 000 lbf transducer read in mV/V, from 500 lbf to 25 000 lbf. Eleven, because as Nigel Tufnel (Legendary Spinal Tap Guitarist) taught us, “these go to eleven.” The zero reads 0.000 02 mV/V before loading and 0.001 24 mV/V after, a net change of 0.001 22 mV/V, about 0.03 % of the 4.085 mV/V full-scale output. A change that small should be a footnote. I reduced the same eleven indications three ways, using three conventions that are all in actual use: the one NIST applies, which assigns the change by position in the series so the first point carries none of it and the last carries all of it; the one common in industry software, which assigns it by point count so even the first point carries a share; and the one NPL applies, which interpolates across the whole run with the zero readings themselves treated as points in the sequence. Every one of them is defensible. None of them is wrong.
If you trade Grateful Dead tapes, you already know this argument. Cornell 5/8/77 circulates as a Betty Board, an official release, and a stack of fan transfers. Same night, same notes, and collectors have spent decades arguing over which transfer is the real one. Zero reduction under Method B is the metrologist’s version of that argument, except this one moves your verified range of forces or torques. I’m also trying more than ever to bring the Grateful Dead into more articles. This is the third mention of them, for those keeping track. The fourth if you count my biography in the Metrology Handbook 3rd edition.
Strip away the descriptions and all three are the same calculation. Each subtracts an interpolated zero built from the initial and final zero indications through a zero-change factor, wi, the fraction of the observed zero change assigned to point i:
Vcorr(Fi) = V(Fi) − [V(0initial) + wi(V(0final) − V(0initial))]
The three conventions differ only in wi. Figure 2 shows the factor each one applies across the run, with the formula behind it.
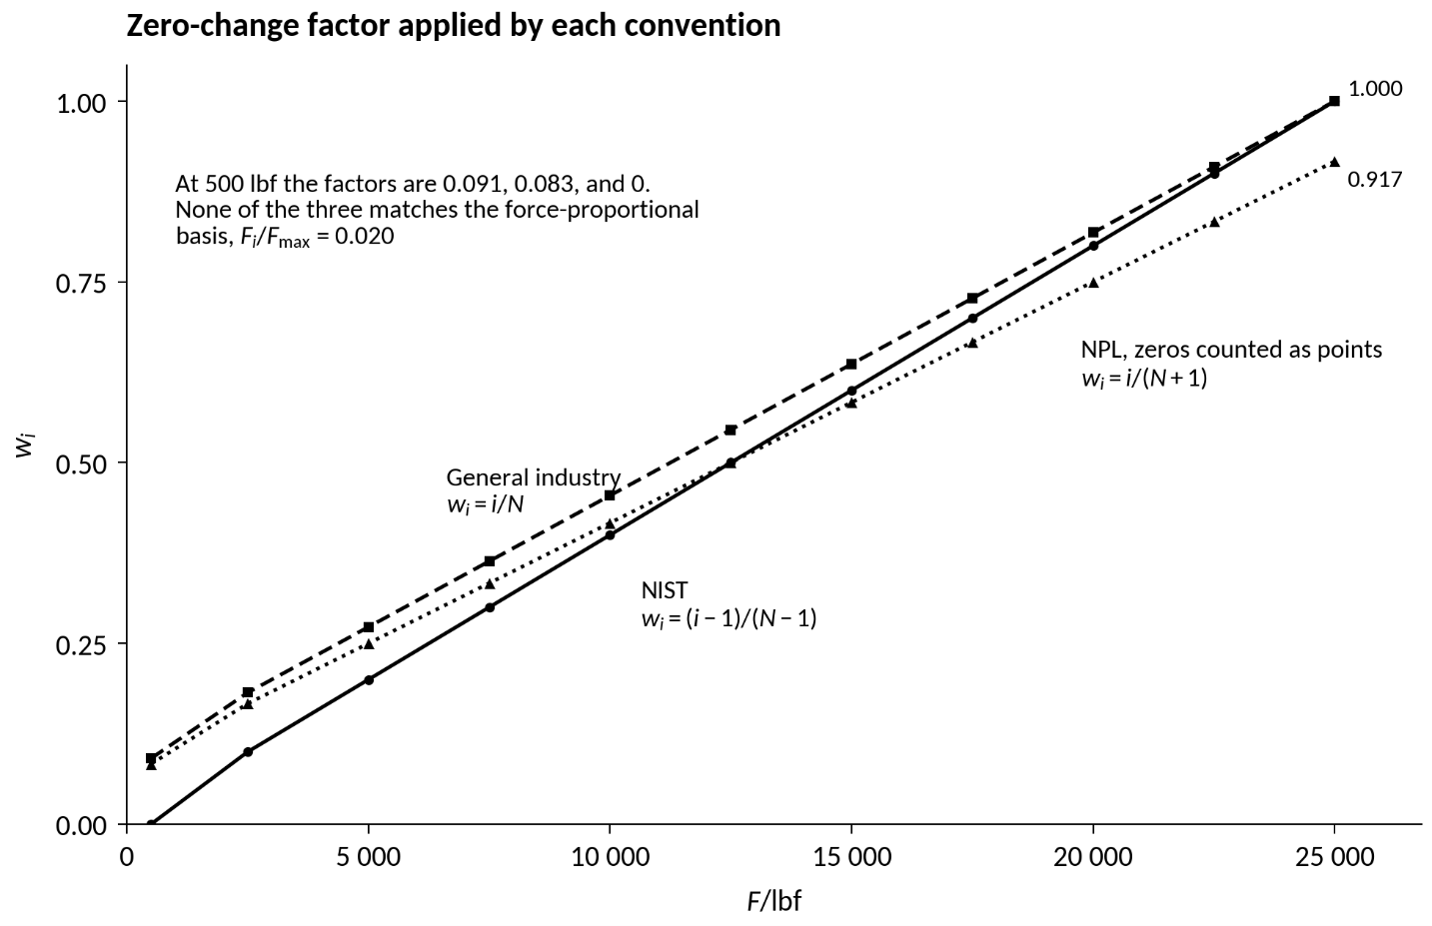
Figure 2 The zero-change factor, wi, each convention applies across the eleven-point run (n = 11 force points, N = 11). Multiplying wi by the observed zero change of 0.001 22 mV/V gives the interpolated zero subtracted at each point. The NPL convention counts the zero readings as points in the sequence, so it assigns only 11/12 of the observed change at the final force point.
Then I fitted the same third-degree polynomial to all three data sets, exactly as the standards prescribe. Here is what came back.

Read the last column again. The lowest force at which this device qualifies for Class AA use moved by 50 lbf, from 663 lbf to 713 lbf, and the LLF swung from 0.332 lbf to 0.357 lbf, about 7.5 %, on identical indications from identical loadings. The Class A limit moves right along with it, from 133 lbf to 143 lbf; Figure 3 shows both. The deflections themselves never disagreed by more than 0.000 11 mV/V, and the worst disagreement sits exactly where GUM-5 says the trouble lives: at the bottom of the range, where 0.000 11 mV/V is 0.13 % of the reading. Nothing physical changed. No transducer, no reference, no reading. The only variable was the arithmetic used to split one 0.001 22 mV/V zero change across eleven points, a choice most technicians never see because their software made it for them.
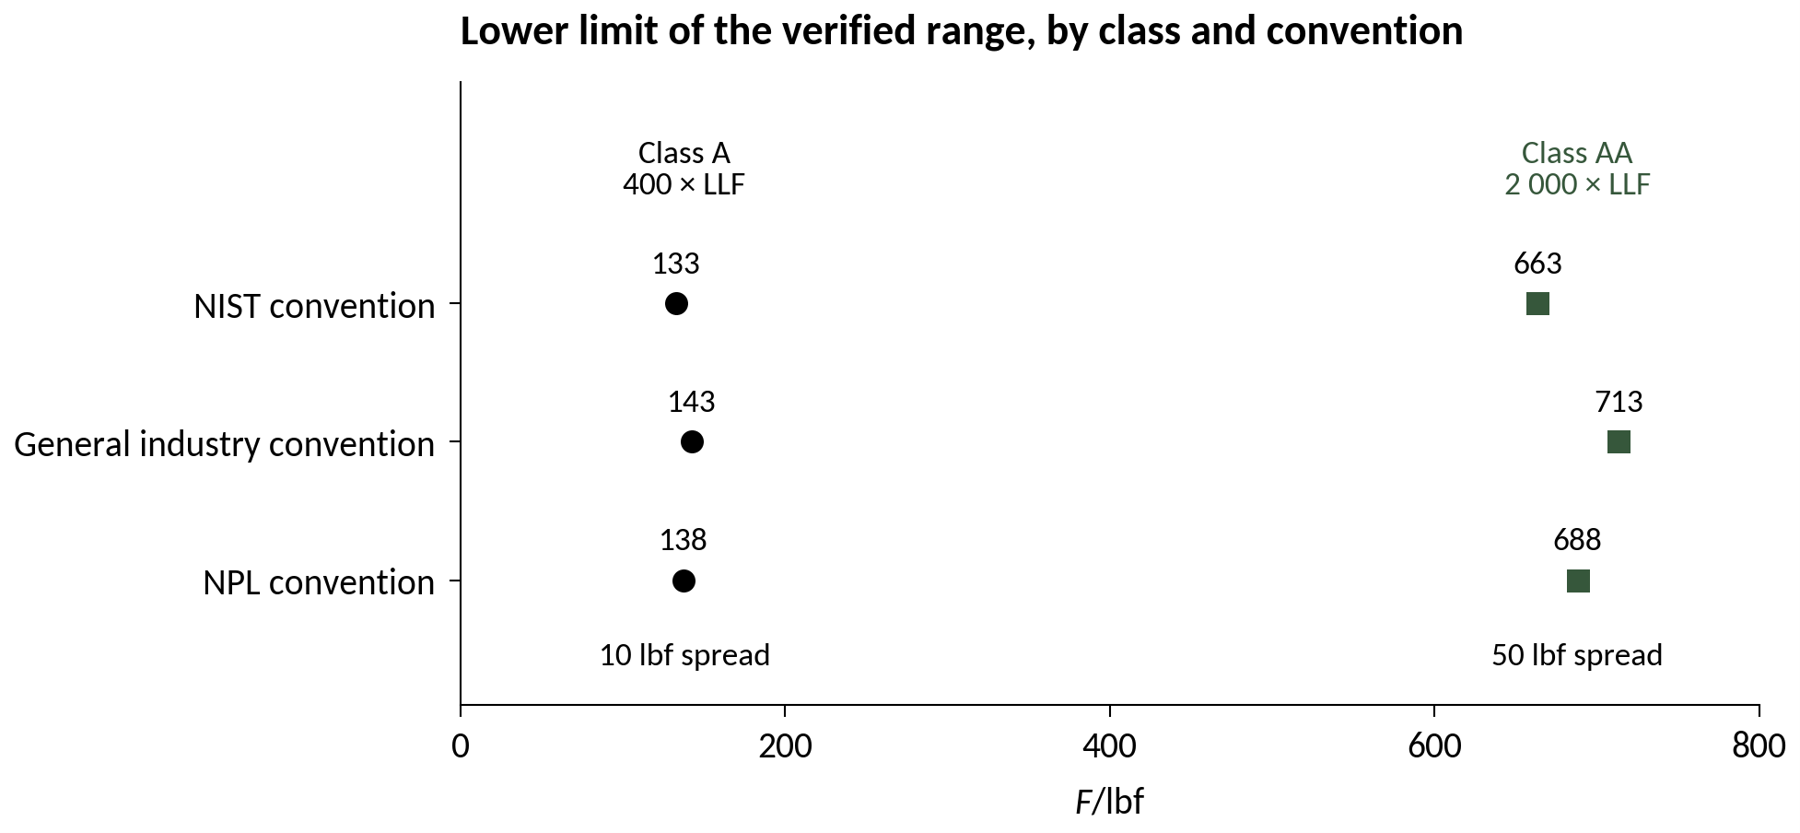
Figure 3 The lowest force at which the device qualifies for Class A (400 × LLF) and Class AA (2 000 × LLF) use under each zero-reduction convention, computed from the same eleven-point run (n = 11 force points per fit).
This is the E74 and E2428 version of Example 9, and it is why I have a revision before ASTM Subcommittee E28.01 right now for E2428, with a parallel change drafted for E74. The proposal writes exactly this calculation into the standard as a new equation, with the zero-change factor defined as a quantity, wi. It recommends the factor τi / τmax, which assigns the observed change in proportion to the applied torque, permits any factor between 0 and 1, and asks the laboratory to document the factor it used. The revision does not claim to know how the zero actually drifted between two readings. Nobody observed it, and no convention can claim to be the physics. What it can do is what the least-squares requirement already does for the fit: make sure two laboratories handed the same data compute the same deflections, or at least state their math plainly enough that an auditor, a customer, or a proficiency-test coordinator can reconcile the difference.
That is the through-line from the JCGM torque example to the Method B math examples on zero reduction. The curve fit is part of the measurement, and so is every reduction step upstream of it. Agreement between laboratories does not start at the uncertainty budget. It starts with using the same math on the same data, and declaring it when you cannot.
So ask four questions of your own process this week. What fit does your software actually perform, and does it match the standard you claim? How does it reduce the zeros under Method B, and would a second laboratory reduce them the same way? Where in your range is the scatter largest, and do your repeats reflect that? And does your reported uncertainty carry the fit’s contribution, or only the budget lines you typed in by hand?
Go deeper
Example 9 runs from clause 9.1 to 9.7 of JCGM GUM-5:2026, which you can download for free from the BIPM. For the working-lab side of calibration curve fitting, coefficients, verified ranges, and the LLF, the e-book Force Calibration for Technicians: Top Conditions, Methods, and Systems that Impact Force Calibration Results (4th edition, 2026) walks through every calculation with worked numbers, and it is available at mhforce.com. If you want help evaluating what your calibration curve is really telling you, contact us.
Last but not Least
Our new calibration certificates have this language on them.
The measurement results are traceable to the International System of Units (SI) through a National Metrology Institute (e.g., NIST) that is a signatory to the CIPM MRA.
One might think the reference may sound strange, though our torque measurement results are traceable to SI Units through an NMI that is not NIST, as NIST does not offer torque service.
Read the "e.g." the way it is written. It is an example, not a requirement. The clause names NIST because NIST is the institute most of our customers know, and because our force traceability genuinely runs through NIST. It does not say that every result on the certificate comes from NIST. What the clause commits us to is the part that matters: the results are traceable to the SI through a national metrology institute that is a signatory to the CIPM MRA. Which institute depends on the quantity.
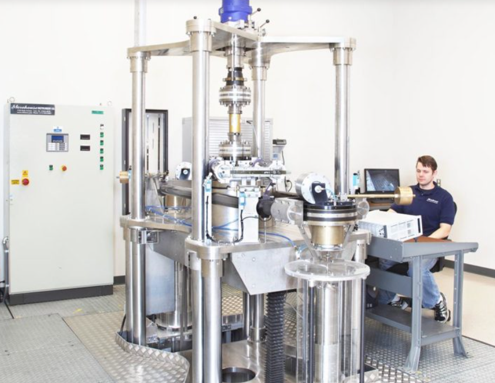
Figure 4 Henry Zumbrun in 2011 running a torque calibration.
For torque, NIST cannot be that institute. NIST says so itself. It offers calibration services for the component quantities torque is derived from, force and length, and it does not offer a calibration service for torque. It is not covered for torque in the CIPM MRA. So no laboratory in the United States can hand you a torque measurement traceable to the SI through NIST. Not us, not anyone.
Our torque traceability runs through NPL, the United Kingdom's national metrology institute and a CIPM MRA signatory for torque. NPL built and commissioned our deadweight torque machine at our facility in York, Pennsylvania, and the same machine has been used in CIPM comparisons. It is the only national torque standard in North America.
Here is what that buys you. In force, our primary deadweight standards run from 0.049 N to 533.787 kN (5 gf to 120 000 lbf) with a calibration and measurement capability typically better than 0.002 % of applied force in compression and tension, k = 2, approximately 95 % confidence, and our secondary standards carry that to 10 MN (2 250 000 lbf) in compression and 4.45 MN (1 000 000 lbf) in tension, typically better than 0.01 % of applied.
In torque, the deadweight primary standard is accurate to 0.0025 % of applied torque through 2 000 N·m (1 475 lbf·ft). Those are the numbers on our scope of accreditation, not marketing figures, and your provider's numbers are on theirs. Go read them.
So ask your torque provider three questions. Which NMI closes your torque loop? Is that institute covered under the CIPM MRA for torque, or only for force and length? And if the answer that comes back is "traceable to NIST," does anyone in that chain know NIST does not offer the service?
This is the same argument as the zero reduction, one level up. Declare the math and declare the path. An auditor can reconcile a difference you stated. They cannot reconcile one you left blank.
Go back to where this started. Same lab, same data, same physics, and four answers. Then one zero change split three ways, and three different verified ranges out the other end. Then a certificate clause where the honest answer depends on which quantity you are asking about. Not one of those is a transducer problem. We have a math problem, and a disclosure problem, and both of them are ours to fix.
So fix the part you control this week. Find out what fit your software actually runs, how it reduces your zeros under Method B, and which NMI closes the loop for every quantity on your certificate. Write those three answers down. If you cannot write them down, you do not know them yet, and neither does your customer.
-Henry Zumbrun, Morehouse Instrument Company
References
BIPM, IEC, IFCC, ILAC, ISO, IUPAC, IUPAP, and OIML. Guide to the expression of uncertainty in measurement — Part 5: Examples. Joint Committee for Guides in Metrology, JCGM GUM-5:2026, clauses 9.1 to 9.7. doi:10.59161/YNLY8209.
BIPM, IEC, IFCC, ILAC, ISO, IUPAC, IUPAP, and OIML. Evaluation of measurement data — Guide to the expression of uncertainty in measurement. Joint Committee for Guides in Metrology, JCGM 100:2008. doi:10.59161/JCGM100-2008E.
Martens, S., Klauenberg, K., and Elster, C. EMUE-D6-2-CalibrationUncertaintyGUMvsBayesian. EMPIR project 17NRM05 EMUE, Physikalisch-Technische Bundesanstalt, 2020. doi:10.5281/zenodo.3858120.
Zumbrun, H. Force Calibration for Technicians: Top Conditions, Methods, and Systems that Impact Force Calibration Results, 4th edition, Morehouse Instrument Company, 2026. Available at mhforce.com.
ASTM E74, Standard Practices for Calibration and Verification for Force-Measuring Instruments.
ASTM E2428, Standard Practice for Calibration and Verification of Torque Transducers.
ISO 376, Metallic materials — Calibration of force-proving instruments used for the verification of uniaxial testing machines.
VDI/VDE 2600 Part 2 (source of the measurement data used in GUM-5 Example 9).
About Morehouse
We believe in changing how people think about Force and Torque calibration in everything we do, including, "Calibration Curve Fitting"
This includes setting expectations and challenging the "just calibrate it" mentality by educating our customers on what matters and what may cause significant errors.
We focus on reducing these errors and making our products simple and user-friendly.
This means your instruments will pass calibration more often and produce more precise measurements, giving you the confidence to focus on your business.
Companies around the globe rely on Morehouse for accuracy and speed.
Our measurement uncertainties are 10-50 times lower than the competition, providing you with more accuracy and precision in force measurement.
We turn around your equipment in 7-10 business days so you can return to work quickly and save money.
When you choose Morehouse, you're not just paying for a calibration service or a load cell.
You're investing in peace of mind, knowing your equipment is calibrated accurately and on time.
Through Great People, Great Leaders, and Great Equipment, we empower organizations to make Better Measurements that enhance quality, reduce risk, and drive innovation.
With over a century of experience, we're committed to raising industry standards, fostering collaboration, helping with understanding risk, and delivering exceptional calibration solutions that build a safer, more accurate future.
Contact Morehouse at info@mhforce.com to learn more about our calibration services and load cell products.
Email us if you ever want to chat or have questions about a blog.
We love talking about this stuff. We have many more topics other than, "Calibration Curve Fitting"
Our YouTube channel has videos on various force and torque calibration topics here.