

Two Degrees Off: What Mount Erebus Teaches Us About Measurement Bias
I recently read 10x Is Easier Than 2x by Dan Sullivan and Dr. Benjamin Hardy, and one story in it made me think about calibration, specifically a paper I wrote three years ago on bias. Before we get to that, here’s more about what I read and the consequences.
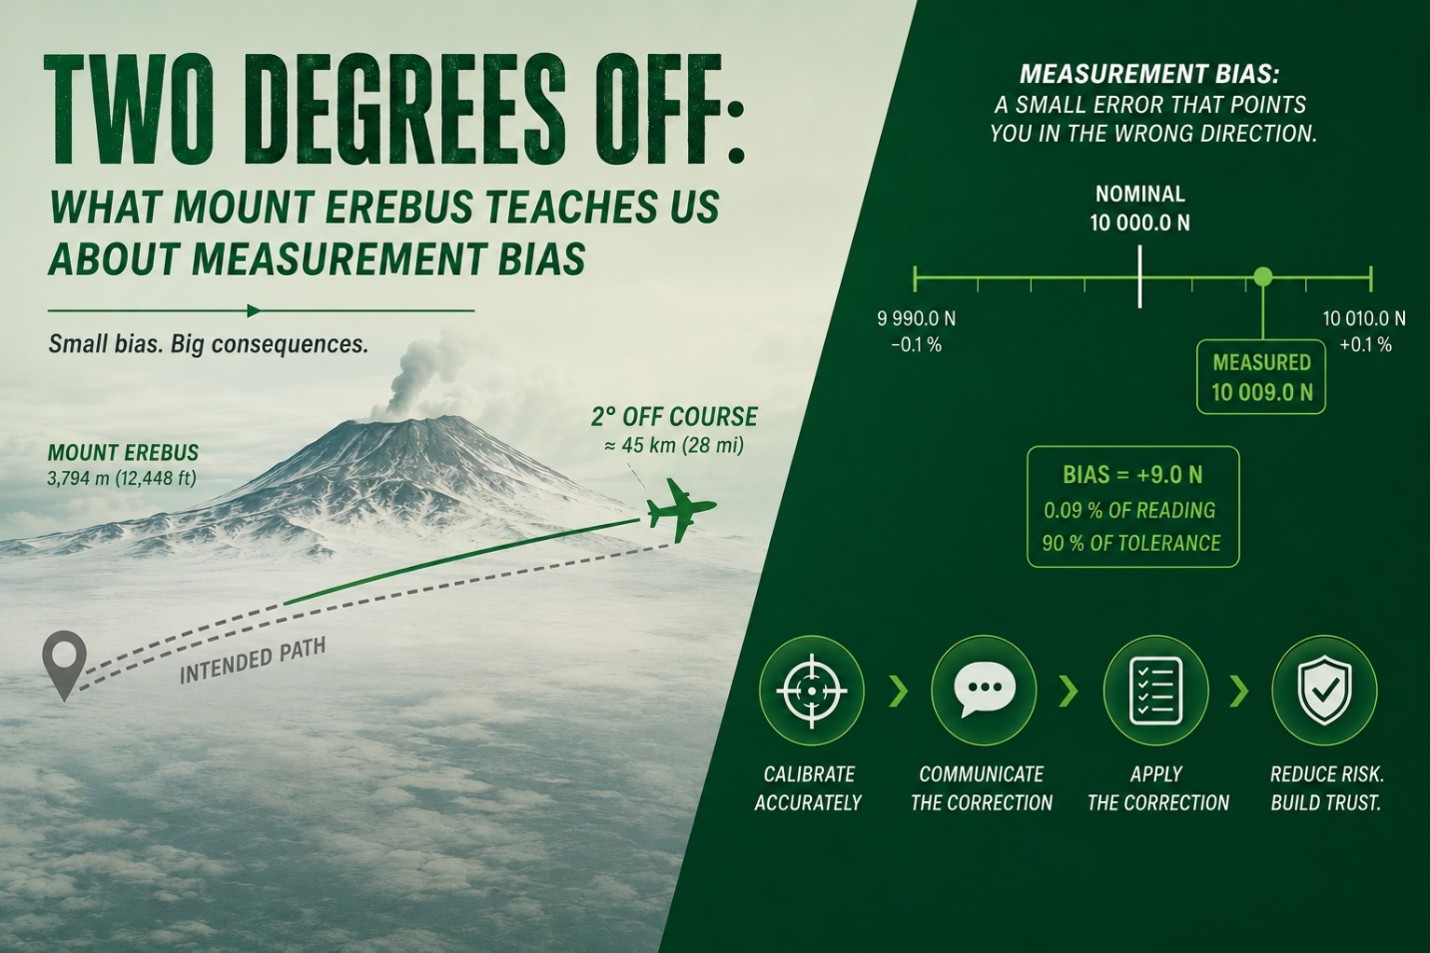
On November 28, 1979, Air New Zealand Flight 901 left Auckland with 257 people on board for a sightseeing flight over Antarctica. Unknown to the pilots, someone had modified the flight coordinates by a mere two degrees (in percentage terms, this is about 0.56 % off). That small change placed the aircraft about 45 km (28 mi) east of where the pilots believed they were. Both were experienced. Neither had flown this particular route before. And the new track pointed directly at Mount Erebus, an active volcano rising 3 794 m (12 448 ft) out of the ice.
As they descended to give the passengers a better view, the snow on the volcano blended with the cloud above it. Pilots call this sector whiteout. Rising terrain looked exactly like flat ground stretching to the horizon. By the time the ground proximity warning sounded, the crew had about six seconds. Everyone on board died.
Two degrees.
Sullivan and Hardy tell the story to make a point about your fitness function, the specific standard you optimize your life against. Your fitness function points in the direction you are ultimately going and, in their words, "who you're ultimately becoming." Nudge it slightly, and you arrive somewhere radically different.
It’s a good chapter, and there’s a lot more in the book. I read that chapter and thought about calibration certificates.
How does a plane crash in Antarctica relate to force calibration, or calibration? The same way everything in conformity assessment does: location, location, location. It turns out real estate agents and metrologists agree on exactly one thing, well, at least some of us do. Some will argue that the population of data needs to be considered, though population data can hide extremes, and the 257 people on board and their families knew only one outcome: tragedy!
The two degrees hiding in your measurements
Measurement bias is a systematic error, a consistent deviation between the measured value and the true value of the quantity being measured. It is not random noise. It points in one direction, every single time, like a flight path drawn two degrees off course.
If you prefer the Hollywood version, it is the opening scene of Raiders of the Lost Ark. Indiana Jones eyeballs the golden idol, fills a bag with what he estimates is the same weight in sand, and makes the swap. His estimate carries a small bias. The temple's conformity assessment catches it instantly, and the corrective action is a giant boulder. It’s a fantastic opening scene and might be one of the best of all time to pull you directly into the story.
Here is a real example from our lab. A force-measuring device with a specification of 0.1 % of full scale is calibrated at 10 000.0 N. The specification limits are 9 990.0 N and 10 010.0 N. The device reads 10 009.0 N.
Is the device in tolerance? Yes. Does the certificate say "Pass"? Depending on the decision rule agreed to under contract review, it might. So, everyone is happy, and we are done here, right?
Not even close.
The bias is 9.0 N. That is 0.09 % of the measured value and 90 % of the tolerance. This instrument is not cruising over flat ice at the center of its specification. It is two degrees off course with a volcano ahead, and the paperwork says everything is fine.
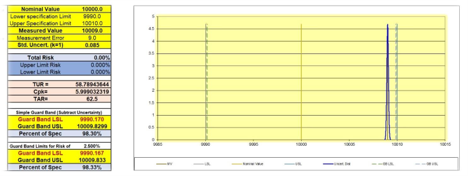
Figure 1: Measured value of 10 009.0 N against a 10 000.0 N nominal, calibrated at a 58.79:1 TUR. The bias is unmistakable, and the total risk is still 0.00 %.
The correction nobody talked about
The popular retelling of Erebus ends at "small error, terrible tragedy." The full story is the one that should keep every quality manager up at night.
The coordinate error had lived in the airline's computerized flight plan for months. Crews flew the incorrect track down the flat expanse of McMurdo Sound, and the crew of Flight 901 was briefed on that track. Then, the night before the flight, someone corrected the coordinates. The waypoint moved about 45 km east, directly over the volcano.
Nobody told the crew.
Think about that for a minute. The correction itself was accurate. The failure was fixing a known systematic error without telling the people relying on the old numbers. A correction that is not communicated is not a correction. It is a brand new error wearing the uniform of a fix.
Now run the calibration version. The lab reports a measured value of 10 009.0 N at an applied force of 10 000.0 N. Does the end-user load the device to 10 009.0 N to apply a true 10 000.0 N? Do they program a coefficient into the indicator? Do they carry the 9.0 N into the uncertainty budget as a correction in the measurement model? Or does the certificate go into a drawer while everyone on the floor keeps typing 10 000.0 N into the process?
If it is the drawer, the word "Pass" on that certificate is doing an awful lot of work. Inigo Montoya might say: you keep using that word. I do not think it means what you think it means.
JCGM 200:2012 defines metrological traceability as the "property of a measurement result whereby the result can be related to a reference through a documented unbroken chain of calibrations, each contributing to the measurement uncertainty." In plain language: every link in the chain must carry its uncertainty forward, and a known bias that is neither corrected nor accounted for breaks the chain. ISO/IEC 17025:2017 section 6.5 requires that chain. The certificate might look complete. The traceability is gone, exactly the way Flight 901's navigation looked complete right up until the terrain warning.
Whiteout conditions in the laboratory
What stole the crew's last chance was whiteout. No contrast. A rising volcano indistinguishable from flat ice.
Large measurement uncertainty does the same thing to a calibration. It removes the contrast you need to see a bias drifting toward a limit.
We watched this happen. A customer sent us two bolt testers on a regular calibration cycle. One always came back centered. Low to no bias. Flat ice as far as the eye could see. The other drifted, calibration after calibration, creeping toward the acceptance limits.
Our deadweight primary standards carry an expanded uncertainty of about 0.002 % of applied force (k = 2, approximately 95 % confidence). Against a 0.1 % specification, that is a Test Uncertainty Ratio (TUR) of 58.79:1, and at that resolution, the drift stood out like a mountain against blue sky.
The customer did not correct it. The tester eventually failed calibration, and we were informed the out-of-tolerance condition triggered a recall that cost more than a million dollars.
What if the bias had been corrected at the first sign of drift? What if the certificate had been read instead of filed? What if the device had been adjusted one cycle earlier? Any one of those decisions avoids the recall.
Now run the same 10 009.0 N reading through a provider with a calibration process uncertainty of 0.025 %, a 4:1 TUR against the same specification. The Probability of False Accept (PFA), the risk that this instrument, with this reading, is actually out of tolerance, jumps to 21.19 %. Roughly one in five. Vegas builds casinos on odds better than that. And the slow drift that gave our customer years of warning becomes far harder to separate from noise.
That 21.19 % deserves one more label, because Introduction to Statistics in Metrology is careful about it. It is a specific risk, sometimes called bench-level risk: the probability that this instrument, with this reading, is out of tolerance. A TUR-based decision rule was never built to manage that number. TUR thresholds belong to global risk, the false accept rate averaged across every instrument the rule touches, and 4.6:1 keeps that average under 2 % only when at least 80 % of the population arrives in tolerance, and nobody is dragging a bias. Global risk runs a program. It says nothing about the one device parked at 90 % of its tolerance. Population data can hide extremes. Flight 901 was one of thousands of safe flights, and the average was excellent.
That is whiteout. The terrain is rising, and the view out the windshield still looks flat.
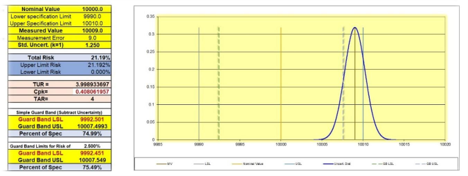
Figure 2: The same 10 009.0 N measured value through a provider at a 4:1 TUR. Total risk is now 21.19 %.
Two points cannot see the volcano between them
Where does a bias like this come from in the first place? Often from something as routine as how the meter was programmed.
A common practice is the 2-pt span: program the indicator at zero and at capacity, and let a straight line connect them. The meter now reads exactly right at both endpoints. Simple, right?
A 2-pt span is the metrology version of a stopped clock: perfectly correct at exactly two points and quietly wrong everywhere in between. At least the stopped clock is not printing calibration certificates.
The flight plan for Flight 901 was correct at both endpoints, too. The departure waypoint matched. The destination waypoint matched. The volcano was between them.
A 2-pt span cannot see anything between its two points, and load cells are not straight lines. Their response bows, and every force between zero and capacity rides that curve. We documented this on one of our own 10 000 lbf load cells. Programmed with a 2-pt span, the worst point landed at 4 000 lbf, where the indication differed from the applied force by 3.06 lbf. Programmed instead with polynomial coefficients generated from its calibration data, the same load cell on the same meter agreed to about 0.001 % of full scale. Same cell. Same meter. The difference between the two programming methods at that point works out to 2 413 %.
And here is the trap: 3.06 lbf on a 10 000 lbf load cell sounds like nothing. It is 0.031 % of capacity.
Now run the pass/fail decision both ways. Say the tolerance at 4 000 lbf is 0.1 % of reading, so the specification limits are 3 996.0 lbf and 4 004.0 lbf. The calibration provider's expanded uncertainty is 1.0 lbf (k = 2, approximately 95 % confidence), which gives a 4:1 TUR, and the agreed decision rule is ILAC-G8:09/2019 with a guard band equal to the expanded uncertainty. That places the acceptance limits at 3 997.0 lbf and 4 003.0 lbf.
Bias corrected, the device reads 4 000.10 lbf. Comfortably inside the acceptance limits. Conformity statement under the agreed rule: Pass, with a probability of false accept of effectively 0.00 %.
Bias left alone, the device reads 4 003.06 lbf. That is outside the guard-banded acceptance limit, and under the agreed rule the lab cannot state a Pass. A load cell that would sail through with coefficients is now headed for adjustment, investigation, or a failed calibration, along with the downtime, retest costs, and paperwork that follow. The pass/fail decision just flipped on a programming choice.
What if the lab used simple acceptance instead, no guard band, pass anything inside the specification limits? Then 4 003.06 lbf squeaks through as a "Pass," and the probability of false accept climbs to 3.0 %. One bad call in every 33. And every measurement made with that load cell afterward quietly inherits the 3.06 lbf, exactly like the uncorrected reference standard dragging its 9.0 N down the pyramid in the next section.
Correct the bias, and both problems disappear. Leave it alone, and you get to pick which one you want: failing good equipment or trusting bad measurements. That is the whole menu.
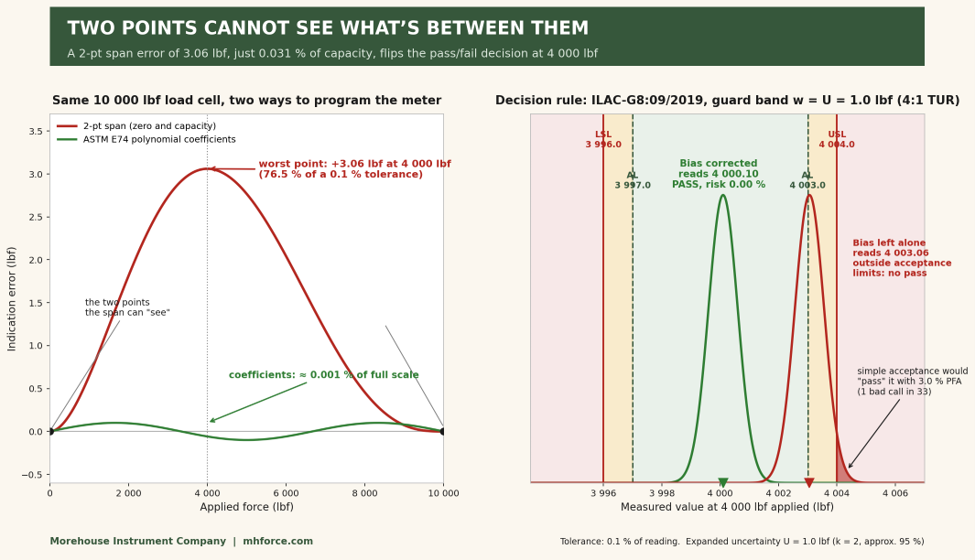
Figure 3: The same 10 000 lbf load cell programmed two ways. The 2-pt span leaves a 3.06 lbf error at 4 000 lbf that flips the conformity decision under the Method 5 guard-banded decision rule.
This, incidentally, is one of the quieter arguments in the TEDS conversation. An IEEE 1451.4 TEDS chip can store a basic 2-pt calibration template, or it can store linearization data and curve-fit polynomials. Which template gets used decides whether the chip carries the volcano along with it.
The cascade down the traceability pyramid
Bias does not stay put. Measurements flow downhill, from primary standards to reference standards to working standards to the production floor, and an uncorrected bias rides along, compounding with the uncertainty at every tier.
If you have seen Office Space or Superman III, you know the scheme: skim fractions of a cent that nobody will ever notice and let the volume do the rest. Uncorrected bias runs the same con on a traceability chain. Every tier skims a little accuracy nobody notices, and by the bottom of the pyramid, somebody has to explain where all the newtons went.
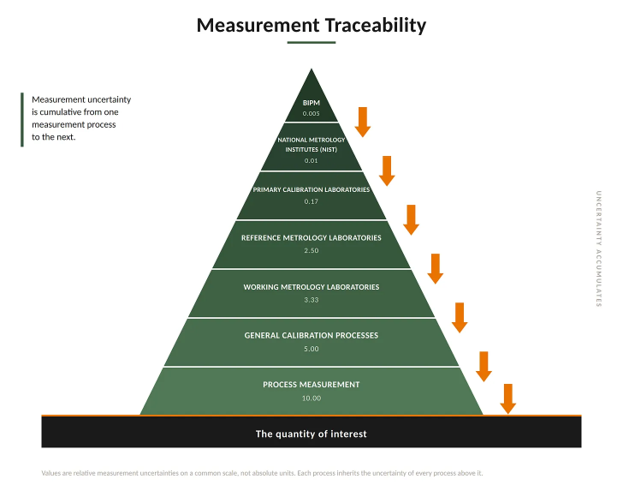
Figure 4: The measurement traceability pyramid. Measurement uncertainty is cumulative from one level of the hierarchy to the next.
We simulated the whole chain. Starting from the device that read 10 009.0 N at an applied force of 10 000.0 N, we generated random measurement results down the pyramid twice: once correcting the 9.0 N bias at each tier, once leaving it alone.
Correct the bias at every level, and total risk stays at essentially 0.00 % through the reference (4:1), working (3:1), and general (2:1) tiers, reaching only 4.76 % at the 1:1 process level.
Leave it alone, and the reference tier carries a total risk of 78.81 %. The working tier hits 96.41 %. The general tier comes in at 65.54 %. By the process level, the risk reaches 97.25 % and the simulated device sits 20 N from nominal. Twice the entire tolerance. And every certificate along the way said "Pass."
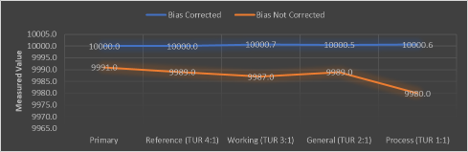
Figure 5: Simulated measured values down the pyramid with the 9.0 N measurement bias corrected versus not corrected. The uncorrected path drifts to 9 980.0 N by the process tier.
This is also why the beloved 4:1 TUR rule deserves more scrutiny than it usually gets. Start with what a TUR is: a ratio of two widths, the tolerance interval over the expanded calibration process uncertainty (k = 2, approximately 95 % confidence). That is all it is. The ratio carries no information about where the measured value landed inside the tolerance. Introduction to Statistics in Metrology traces the TUR back to the 1950s, when it was shorthand for labs that had no practical way to compute false accept and false reject probabilities in full. Computers fixed that decades ago, and the authors recommend computing the actual risk instead of leaning on the ratio alone.
The shorthand also comes with fine print. Section 5.2 spells out the assumptions: all measurement biases have been removed from the process, the measurements follow a normal distribution, and the population of instruments is centered between the specification limits. Meet all three and the 4:1 benchmark delivers exactly what it promises, a global false accept risk held under 2 % whenever roughly 80 % or more of the instrument population arrives in tolerance. That makes 4:1 a global risk decision rule. It protects the program on average. The ratio only protects you if the measurement is centered.
Bias voids the warranty. A systematic error shifts the whole measurement distribution sideways, and the book is blunt about what happens next: ignore the bias, and "the risk might be understated, perhaps significantly." Its worked example models a bias of only 20 % of the specification limit and shows the true false accept risk climbing past the 2 % target even at 4:1. Our 9.0 N example sits at 90 %. A 4:1 TUR with an uncorrected bias sitting at 90 % of tolerance is not a 4:1 anything. It is two degrees off with the autopilot engaged. And when a bias genuinely cannot be corrected, the book's instruction is direct: put the bias into the risk calculation, quantify it, and decide with eyes open whether the answer is acceptable.
2x thinking, 10x thinking, and your lab's fitness function
Sullivan and Hardy’s core argument is that 2x goals keep you doing what you already do, slightly harder, while 10x goals force you to abandon the 80 % that no longer serves you and go all-in on the vital 20 %. Your fitness function decides which path you are on, whether you ever wrote it down or not.
A calibration program also has a fitness function.
If the function is "cheapest certificate that says Pass," that is 2x thinking, and the program is optimizing toward Erebus. Every downstream decision bends toward that destination: which provider gets the purchase order, whether a decision rule ever gets agreed to, whether the measurement uncertainty is correctly calculated, whether anyone reads the measured values or just the conformity statement. Nobody chooses a recall. They choose two degrees of drift, year after year, and the recall chooses them.
If the function is "measurements we can defend, with bias corrected or accounted for and uncertainty honestly stated," that is 10x thinking. You pick a provider whose uncertainty is low enough to see drift coming, and the difference between a 4:1 and a 58.79:1 TUR is not 2x, it is more than 14x. You agree on a decision rule under contract review before the work is done. You correct known bias, or you load the reference standard to the value that applies the true force, or you carry the bias into the uncertainty budget. JCGM 106:2012 assumes that a measuring system used in conformity assessment has been corrected for all recognized significant systematic errors. That assumption is only true if someone makes it true.
The pre-flight checklist
Pull your most recent calibration certificates and check four things.
- Find the measured values, not just the "Pass." How far is each point from nominal, and what fraction of the tolerance has the bias already consumed?
- Ask what happens to that bias. Is it corrected in your process, entered as a coefficient, or carried into your uncertainty budget? If the answer is "none of the above," your traceability chain has a gap in it.
- Ask your provider for their calibration process uncertainty and work out your actual TUR. Then ask whether, at that uncertainty, you could see a drifting instrument before it reached the limit, or whether you are flying in whiteout.
- Ask which risk your decision rule is managing. A TUR threshold is a global risk tool. It controls the average false accept rate across an entire population of instruments, and only when bias has been removed and the measurements are centered. The instrument on your bench carries its own specific risk, and no fleet average will steer one aircraft around a mountain.
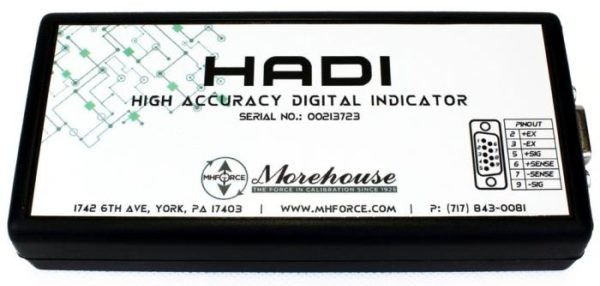
Figure 6: The Morehouse High Accuracy Digital Indicator (HADI). A true 6-wire sensing USB device that uses coefficients from fitted curves to convert mV/V to engineering units, correcting the measurement bias a 2-pt span leaves behind.
That checklist is easier to pass when the bias never makes it into the reading in the first place. This is exactly why we built the Morehouse High Accuracy Digital Indicator (HADI). The HADI is a true 6-wire sensing, fully USB-powered analog-to-digital converter that pairs with Morehouse direct reading software and uses coefficients from fitted curves to convert mV/V into engineering units (lbf, kgf, kN, and N). No 2-pt span. No straight line drawn over a curve. The polynomial maps the bow in the load cell's response, which is another way of saying it sees the volcano between the endpoints and steers around it automatically.
The numbers hold up on the bench. Non-linearity is less than 0.002 % of full scale on a ±20-bit system running 172 A/D conversions per second, and the system supports ASTM Class A lower limits better than 2 % when paired with a Morehouse Ultra-Precision load cell. The HADI with Morehouse software provides direct reading in compliance with ASTM E74, ASTM E2428, and ISO 376, and it eliminates the load tables, spreadsheet reports, and other interpolation methods.
Drift still happens; no system is immune to it. NCSLI RP-12 section 12.3 states, "The uncertainty in the value or bias, always increases with time since calibration." With most indicators, that drift means reprogramming, and because most quality systems require an As Received calibration, the sequence becomes As Received calibration, reprogram, As Returned calibration. Two calibrations and a programming session, every cycle, and the invoice shows it.
The HADI and other Morehouse meters, such as the C705P and 4215 Plus, sidestep the whole loop. Their coefficients are based on mV/V values, so the As Received and As Returned calibrations are the same, and correcting for drift is a coefficient update in the software rather than a reprogramming project. The bias gets corrected, the paperwork stays honest, the quality requirements in ISO/IEC 17025:2017 are met, and the customer pays for one calibration instead of two. That is what correcting the bias automatically looks like: not ignoring the two degrees, but building the course correction into the navigation system itself.
The pilots of Flight 901 were skilled, experienced, and flying exactly right by the numbers they had. The numbers were wrong by two degrees, and nobody told them. Do not let your measurements fly on numbers like that. Find the bias. Correct it. Document it. Tell the people downstream.
And if you want a book that will change how you think about which 20 % deserves everything you have, pick up a copy of 10x Is Easier Than 2x. Just be warned: you may never look at a "Pass" statement the same way again.
And if you want recommended reading on other avoidable disasters, read Henry Petroski’s To Engineer is Human.
-Henry Zumbrun, Morehouse Instrument Company
References and further reading
- Sullivan, D. and Hardy, B., 10x Is Easier Than 2x: How World-Class Entrepreneurs Achieve More by Doing Less, Hay House Business, 2023.
- Zumbrun, H., "Let's Talk About Bias: Measurement Bias," Morehouse Instrument Company, York, PA.
- Zumbrun, H., "The Top 5 Pros and Cons of TEDS for Load Cells," Morehouse Instrument Company, York, PA, source of the 2-pt span versus polynomial coefficient comparison data.
- Morehouse Instrument Company, "Converting an mV/V Load Cell Signal into Engineering Units," on the errors associated with two-point calibration.
- JCGM 200:2012, International Vocabulary of Metrology (VIM), 3rd edition, definition of metrological traceability.
- JCGM 106:2012, Evaluation of Measurement Data: The Role of Measurement Uncertainty in Conformity Assessment.
- ISO/IEC 17025:2017, General Requirements for the Competence of Testing and Calibration Laboratories, sections 3.7 and 6.5.
- Crowder, S., Delker, C., Forrest, E., and Martin, N., Introduction to Statistics in Metrology, Springer, 2020, sections 5.2.1.1, 5.2.1.3, and 5.2.1.5, on TUR assumptions, global versus specific false accept risk, and risk with biased measurements.
- ILAC-G8:09/2019, Guidelines on Decision Rules and Statements of Conformity.
- NCSLI RP-12, Determining and Reporting Measurement Uncertainties, section 12.3, on the growth of bias uncertainty with time since calibration.
- Report of the Royal Commission to Inquire into the Crash on Mount Erebus, Antarctica (Mahon Report), 1981, on Air New Zealand Flight 901.
About Morehouse
We believe in changing how people think about Force and Torque calibration in everything we do, including, "Two Degrees Off: What Mount Erebus Teaches Us About Measurement Bias"
This includes setting expectations and challenging the "just calibrate it" mentality by educating our customers on what matters and what may cause significant errors.
We focus on reducing these errors and making our products simple and user-friendly.
This means your instruments will pass calibration more often and produce more precise measurements, giving you the confidence to focus on your business.
Companies around the globe rely on Morehouse for accuracy and speed.
Our measurement uncertainties are 10-50 times lower than the competition, providing you with more accuracy and precision in force measurement.
We turn around your equipment in 7-10 business days so you can return to work quickly and save money.
When you choose Morehouse, you're not just paying for a calibration service or a load cell.
You're investing in peace of mind, knowing your equipment is calibrated accurately and on time.
Through Great People, Great Leaders, and Great Equipment, we empower organizations to make Better Measurements that enhance quality, reduce risk, and drive innovation.
With over a century of experience, we're committed to raising industry standards, fostering collaboration, helping with understanding risk, and delivering exceptional calibration solutions that build a safer, more accurate future.
Contact Morehouse at info@mhforce.com to learn more about our calibration services and load cell products.
Email us if you ever want to chat or have questions about a blog.
We love talking about this stuff. We have many more topics other than, "Two Degrees Off: What Mount Erebus Teaches Us About Measurement Bias"
Our YouTube channel has videos on various force and torque calibration topics here.