

Where One Term Ends and the Next Begins, Part 7 of 7: PFA and PFR Explained: Probability of False Accept and Reject
A kicker makes 97 % of his field goals from the 35-yard line. This kick is from the 35, and it sails wide. Based on the population data alone, you would have said it was likely to go in. Based on the one kick in front of you, it did not. Both statements are true. They answer different questions.
That is the entire difference between global risk and specific risk, and it is why a customer can be told their instrument passed at 2 % PFA and still have been handed a coin flip.
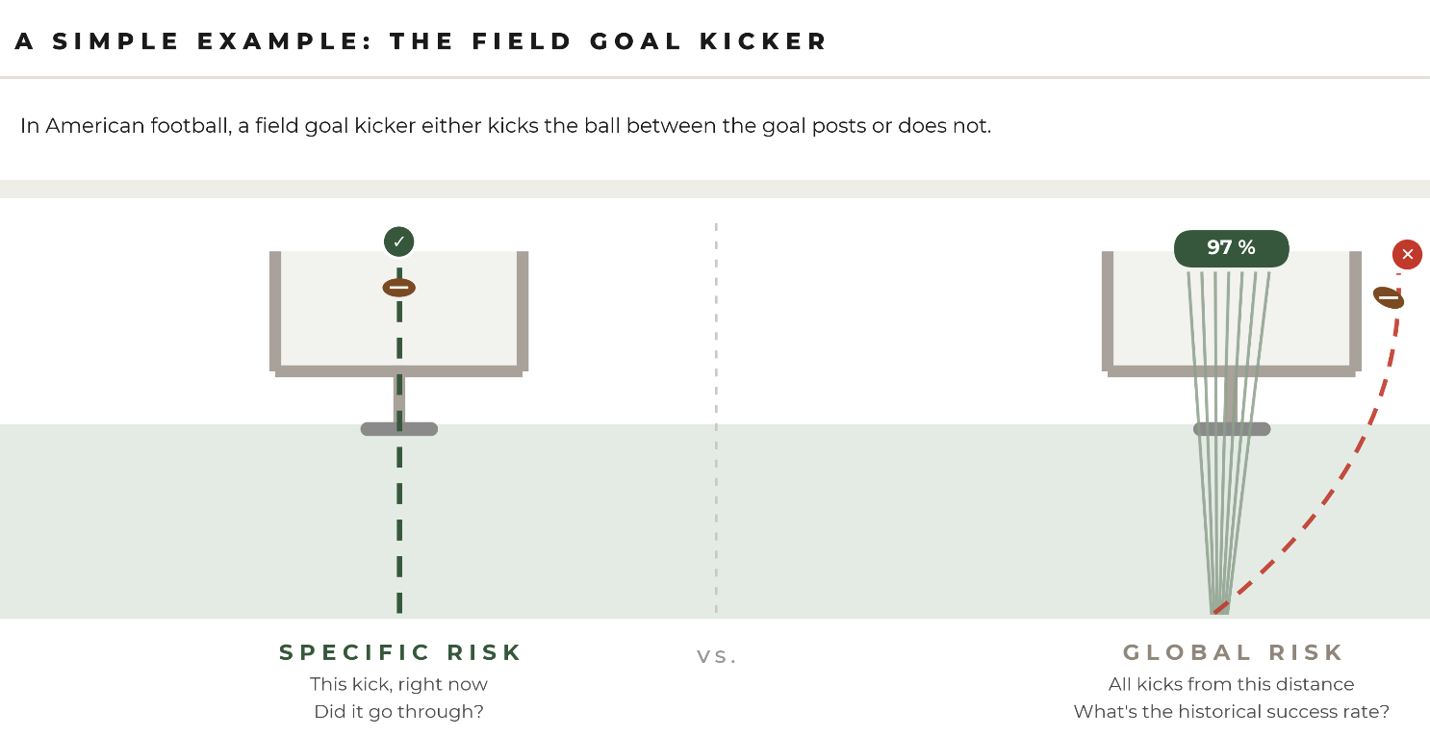
Figure 16. Specific risk is the one kick in front of you. Global risk is the kicker's record from that distance.
The Definitions and the Direction of Each
PFA, the probability of false accept or acceptence, is the chance that an item declared conforming is actually out of tolerance. JCGM 106 calls it consumer's risk; statisticians call it a Type II error; ANSI/NCSL Z540.3 and the audit world shorten it to FAR, the false accept risk. PFR, the probability of false reject, is the chance that an item declared non-conforming is actually in tolerance. That is producer's risk, a Type I error, or FRR, the false reject risk. A guardband moves one up as it moves the other down. Choosing where to set the acceptance limit is, as JCGM 106 says, a business or policy decision that depends on the consequences.
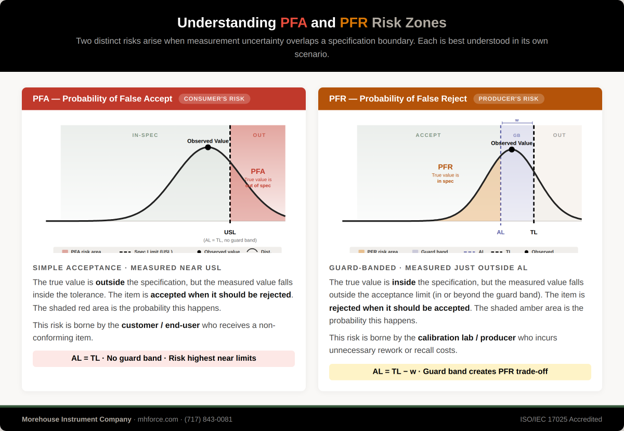
Figure 17. PFA is borne by the customer who receives a non-conforming item; PFR is borne by the lab or producer who rejects a conforming one. A guardband trades one for the other.
Specific Risk: This Result
Picture the bell curve centered on your measured value, its width set by the standard uncertainty. The area of that curve lying outside the tolerance limits is the specific PFA for this result. Excel does it in one line:
Risk upper = NORM.DIST(measured value, upper tolerance limit, standard uncertainty, TRUE)
Risk lower = 1 − NORM.DIST(measured value, lower tolerance limit, standard uncertainty, TRUE)
A 10 000 N load cell with a tolerance of ±0.1 % of full scale reads 10 000 N. The expanded uncertainty is 10 N, k = 2, so the standard uncertainty is 5 N.
- Risk upper = NORM.DIST(10 000, 10 010, 5, TRUE) = 2.275 %.
- Risk lower is the same, so the total specific PFA = 4.55 %.
Run the same formula with the reading at 10 008 N and the upper tail alone climbs to about 34 %.
UKAS LAB 48 makes the same point with a worked example, and our simplified decision rules guidance carries the risk arithmetic for it in a table that should be on every quality manager's wall. Tolerance ±1 unit, simple acceptance.
- A reading of 0.5 with U = ±0.1 passes with a PFA near zero.
- The same 0.5 with U = ±0.8 passes with a PFA near 11 %.
- A reading of 0.9 with U = ±0.8 passes with a PFA near 40 %.
- A reading of 0.99 passes at about 49 %.
Every one of them says PASS on the certificate.
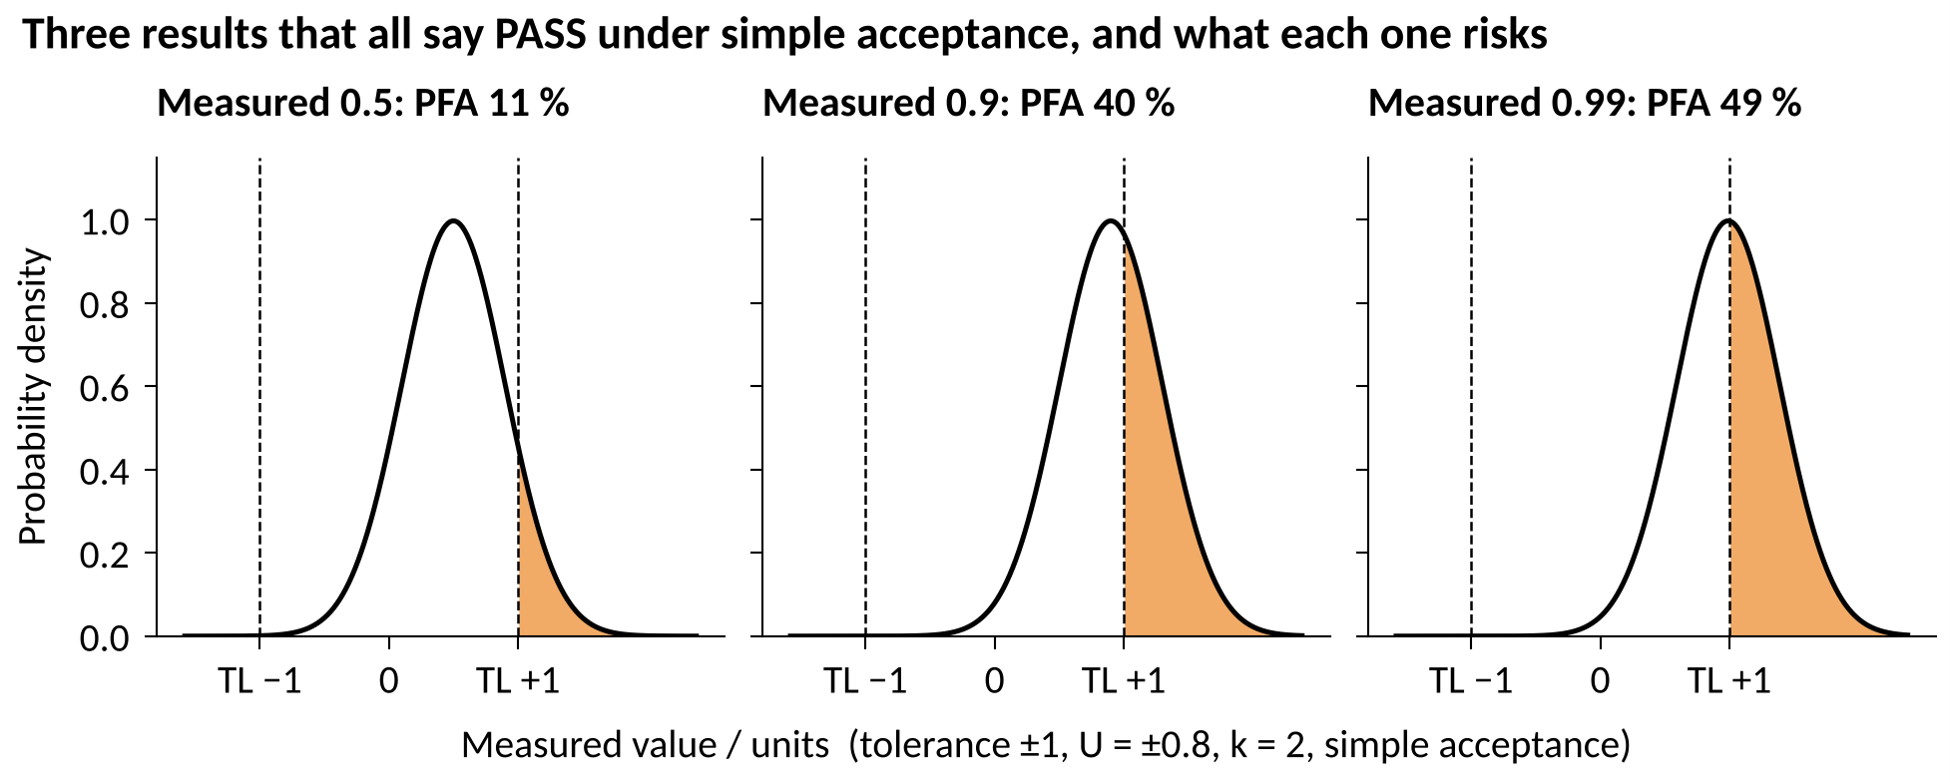
Figure 18. Three results, one tolerance, one uncertainty. Simple acceptance passes all three; the shaded tail is the specific PFA each one carries.
Specific risk needs nothing but the uncertainty and the result. It is the right framework when you have meagre prior information, which JCGM 106 and GUM-5 Example 10 both confirm is the usual case, and when a cautious approach to false accepts is required.
Global Risk: This Process
Global PFA asks a different question: across everything we calibrate of this kind, what fraction of the truly bad ones do we accept? It is an average over the whole population. To compute it, you need the measurement uncertainty and a second distribution, the a priori spread of the items themselves, which comes from history: end-of-period reliability for that make and model at that interval. JCGM 106 Section 9.5.2.2 gives the double integral. SunCal, Mathcad, and the functions in the Decision Rule Guidance appendix solve it.
The catch is what the average hides. ILAC-G8 and the Decision Rule Guidance both make the point that an instrument passing a 2 % global PFA criterion may carry a specific false accept risk approaching 50 % at the tolerance limit. The population looks fine. The one result at the edge is still a coin flip. GUM-5 Example 10 shows the reverse as well: a shared-risk rule on a real air-quality population came out at 0.5 % global consumer's risk and 0.9 % global producer's risk, because most of the population sat well inside the limit. Both numbers are honest. Neither one tells you what happened to the item in your hand.
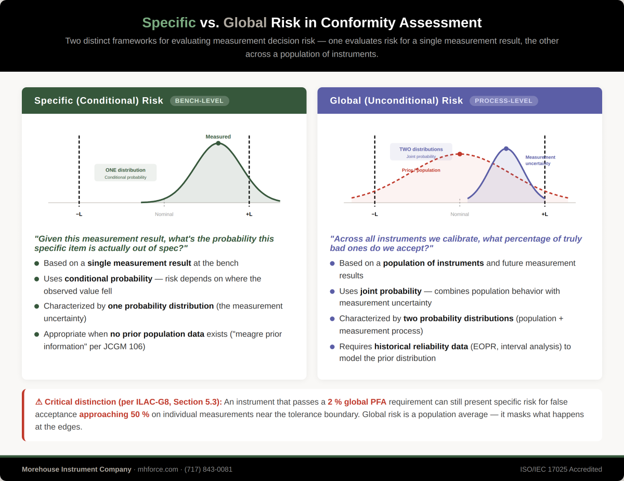
Figure 19. Specific (conditional) risk evaluates one result against one probability distribution. Global (unconditional) risk combines the measurement distribution with the population's prior distribution.
Where the Dollars Are
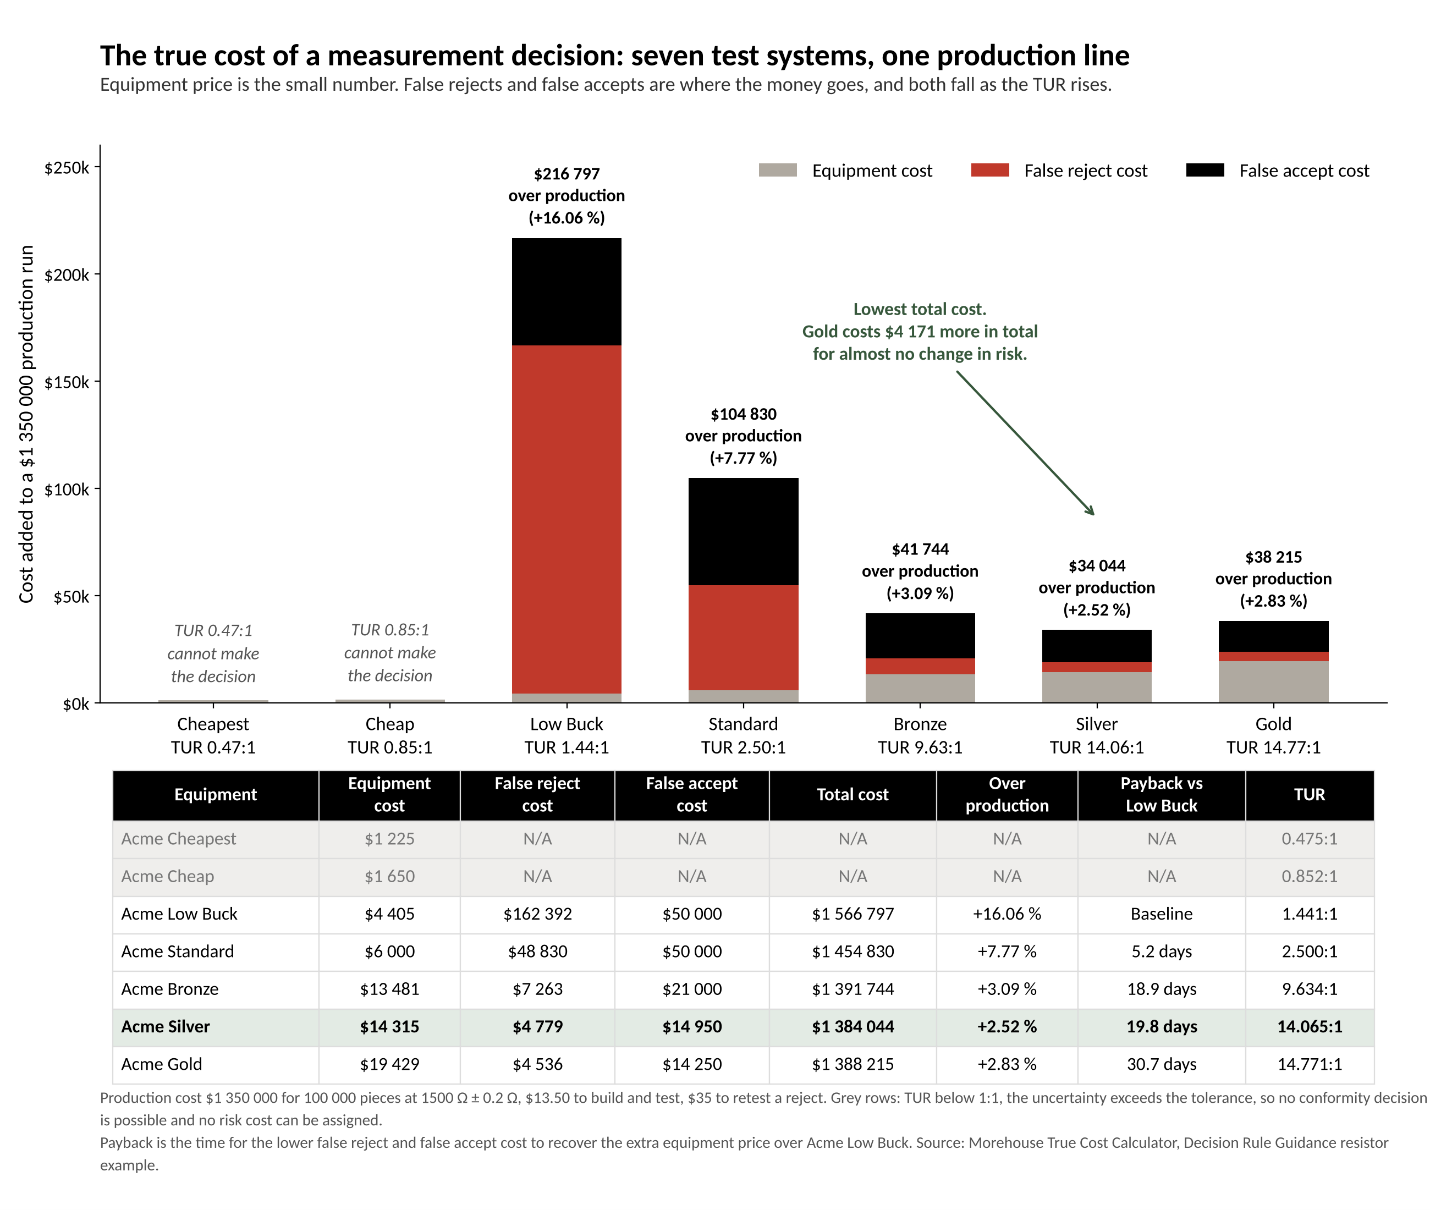
Figure 20. The true cost of a measurement decision. Seven test systems on the same 1500 Ω ± 0.2 Ω production run. Equipment price is the smallest slice of every bar; false rejects and false accepts are where the money goes, and both fall as TUR rises.
Global risk is where the money is, and Figure 20 shows it. Each bar is the same production run measured with a different test system: the gray slice is what the equipment costs, the red slice is false rejects, and the black slice is false accepts. The cheapest systems that can make the decision at all are the most expensive to own. The Decision Rule Guidance works the numbers behind it with a resistor example: 100 000 pieces a month at 1500 Ω ± 0.2 Ω, $13.50 to build and test each piece, $35 to retest a reject, and a test system with a capability index of 2.5. With that setup, 6 838 good pieces a month failed when they should have passed. Between the pieces wrongly rejected and the $35 retest on each one, the bill came to $746 706 against a $1 350 000 production run, more than half the cost of making the parts. And when the rejects were retested, 44.41 % of them passed: nearly half the failures were never failures at all. A better reference instrument raised the capability index toward 9.6 and pushed the expected yield to 99.91 %. That is the drop you see moving right across Figure 20: better measurement pays for itself long before the equipment price matters.
GUM-5 Example 10 puts the trade in standards language. Tightening the acceptance limit enough to drive global consumers' risk from 0.5 % down to 0.002 % raised producers' risk from 0.9 % to 5.8 %. Relaxing it to cap producer's risk at 0.1 % pushed consumer's risk from 0.5 % to 1.7 %. There is no free direction.
What a False Reject Does on Its Way Downstream
A false reject does not stay in the lab. Here is the chain of events from our PFR webinar. A customer's load cell has a tolerance of ±5 lbf at 10 000 lbf, 0.05 % of applied. They send it to a provider whose CMC is 0.05 %, so the TUR is at best 1:1. The instrument reads 10 009 lbf. The provider calls it out of tolerance and adjusts it to read 10 000. Now suppose a second lab, with a TUR of 10:1, calibrates the same instrument when it is next due and finds it reading 9 991 lbf. Out of tolerance again, and adjusted again. Had the first provider left it alone, the instrument would most likely have been sitting near 10 000 all along. The first adjustment was a false reject acted upon, and it planted a 9 lbf bias in a good instrument.
Then it propagates. The customer uses that instrument as a reference to calibrate 0.1 % devices. They load it until it reads 10 000, which means only 9 991 lbf is actually applied, and every device under it inherits the error. Some of those devices fail. Some get adjusted. The lab that made the first bad call never sees any of it, and unless someone is tracking out-of-tolerance rates and asking why they rose, nobody does. The cost ladder of a false reject runs retest, then return, then recall, and each rung is an order of magnitude more expensive than the one before.
The Rule You Pick Sets Your Rework Bill
The Morehouse True Cost Calculator makes the trade concrete for a force lab. Take a ±0.1 % tolerance at 10 000 lbf, an EOPR of 89 %, 200 calibrations a year, and $87.50 per false reject event (35 minutes at $150 an hour). Under Method 6, a machine at 2.2:1 carries a PFR near 10.4 %, which is about $1 820 a year in rework. A machine at 3.3:1 drops to 3.7 % and $643. At 5:1 it is 2.5 % and $440. Deadweight at 50:1 is 0.5 % and $83. A machine at 1.25:1 is 54 % and $9 453, and at 1:1 the PFR reaches 74 %: three of every four good instruments rejected. Same tolerance, same reliability, same rule. Only the uncertainty changed.
Now hold the machine fixed and change the rule. For the 2.2:1 machine, annual rework runs about $913 under a global rule set for 2 % PFA, $1 820 under Method 6, and $5 947 under a specific-risk guardband at 2.5 % per side. For deadweight, the same three rules give $83, $83, and $159. The ordering is always global, then Method 6, then specific, because each rule is more protective of the individual decision than the last and pays for it in false rejects. That ordering is not a flaw in any of the rules. It is the trade you are choosing when you pick one, and the calculator exists so you can see the price before you sign the purchase order.
Note: The cost calculator allows you to vary all of your labor costs, calibration costs, and measurement uncertainty to calculate as close as possible to your actual true costs.
The Boundary
PFA and PFR are outputs. A specific-risk rule calculates them for one result. A global-risk rule is designed to hold them under a target for a population, and needs reliability data to do it. They are not properties of the instrument, the lab, or the TUR on their own; they are what you get when uncertainty, bias correction, capability, a decision rule, and a guardband have all done their jobs in order.
Which brings the series back to where it started. Seven terms, one chain. Uncertainty is the input. Bias is corrected before it. CMC is the floor under it. TUR screens it. The decision rule is the agreement about it. The guardband is the tool. PFA and PFR are the result. Keep them in that order and the messy mix becomes a line you can walk, and defend, from the first reading to the last word on the certificate.
If you want the full treatment with every formula and example, the Decision Rule Guidance is free at mhforce.com, and the calculations run interactively at decisionrules.mhforce.com. Read it, pick your rule, and write it down before the next instrument hits the machine.
-Henry Zumbrun, Morehouse Instrument Company
References
Sources cited across Parts 1 through 7, listed alphabetically. JCGM documents follow the citation form the BIPM recommends, with the member-organization author line and the JCGM DOI. Clause numbers given in the text refer to these editions.
A2LA. R205 — Specific Requirements: Calibration Laboratory Accreditation Program. American Association for Laboratory Accreditation, Frederick, MD.
ANSI/NCSL Z540.3-2006 (R2013). Requirements for the Calibration of Measuring and Test Equipment. NCSL International, Boulder, CO, 2006.
ASME B89.7.4.1-2005. Measurement Uncertainty Conformance Testing: Risk Analysis. The American Society of Mechanical Engineers, New York, 2005.
ASTM E74-18. Standard Practices for Calibration and Verification for Force-Measuring Instruments. ASTM International, West Conshohocken, PA, 2018. https://doi.org/10.1520/E0074-18
BIPM. The BIPM key comparison database (KCDB). Bureau International des Poids et Mesures, Sèvres. https://www.bipm.org/kcdb/
BIPM, IEC, IFCC, ILAC, ISO, IUPAC, IUPAP and OIML. Evaluation of measurement data — Guide to the expression of uncertainty in measurement. Joint Committee for Guides in Metrology, JCGM 100:2008. https://doi.org/10.59161/JCGM100-2008E
BIPM, IEC, IFCC, ILAC, ISO, IUPAC, IUPAP and OIML. Evaluation of measurement data — The role of measurement uncertainty in conformity assessment. Joint Committee for Guides in Metrology, JCGM 106:2012. https://doi.org/10.59161/JCGM106-2012
BIPM, IEC, IFCC, ILAC, ISO, IUPAC, IUPAP and OIML. International vocabulary of metrology — Basic and general concepts and associated terms (VIM), 3rd edition. Joint Committee for Guides in Metrology, JCGM 200:2012. https://doi.org/10.59161/JCGM200-2012
BIPM, IEC, IFCC, ILAC, ISO, IUPAC, IUPAP and OIML. Guide to the expression of uncertainty in measurement — Part 5: Examples. Joint Committee for Guides in Metrology, JCGM GUM-5:2026. https://doi.org/10.59161/JCGMGUM-5-2026
Carroll, L. Alice's Adventures in Wonderland. Macmillan, London, 1865.
Cenker, G., Zumbrun, H. and Shah, D. Decision Rule Guidance. Morehouse Instrument Company, York, PA. https://mhforce.com/documentation-tools/
Dobbert, M. "A Guard-Band Strategy for Managing False-Accept Risk." Proceedings of the NCSL International Workshop & Symposium, Orlando, FL, 2008.
Eagle, A. R. "A Method for Handling Errors in Testing and Measuring." Industrial Quality Control, Vol. 10, pp. 10–15, March 1954.
Grubbs, F. E. and Coon, H. J. "On Setting Test Limits Relative to Specification Limits." Industrial Quality Control, Vol. 10, pp. 15–20, March 1954.
Harris, G. L. "GMP 13 — Good Measurement Practice for Ensuring Traceability." In: Selected Laboratory and Measurement Practices and Procedures to Support Basic Mass Calibrations, NIST IR 6969, National Institute of Standards and Technology, Gaithersburg, MD, 2019.
Hayes, J. L. Factors Affecting Measuring Reliability. U.S. Naval Ordnance Laboratory, Technical Memorandum No. 63-106, Corona, CA, 1955.
ILAC-G8:09/2019. Guidelines on Decision Rules and Statements of Conformity. International Laboratory Accreditation Cooperation, 2019.
ILAC-P14:09/2020. ILAC Policy for Measurement Uncertainty in Calibration. International Laboratory Accreditation Cooperation, 2020.
ISO/IEC 17025:2017. General requirements for the competence of testing and calibration laboratories. International Organization for Standardization, Geneva, 2017.
ISO/IEC 17043:2023. Conformity assessment — General requirements for the competence of proficiency testing providers. International Organization for Standardization, Geneva, 2023.
Mimbs, S. M. "Using Reliability to Meet Z540.3’s 2 % Rule." NCSL International Workshop & Symposium, National Harbor, MD, 2011. NASA KSC-2011-151.
Morehouse Instrument Company. Decision Rules Interactive Calculator. https://decisionrules.mhforce.com
Morehouse Instrument Company. Guidance on Uncertainty Budgets for Force Measuring Devices. York, PA. https://mhforce.com/documentation-tools/
Morehouse Instrument Company. GUM in Plain English (series). York, PA. https://mhforce.com/documentation-tools/
Morehouse Instrument Company. Morehouse CMC Workbook. York, PA. https://mhforce.com/documentation-tools/
Morehouse Instrument Company. Morehouse True Cost Calculator and The True Cost of Measurement Decisions. York, PA. https://mhforce.com/documentation-tools/
Morehouse Instrument Company. Start With the End in Mind. York, PA, 2026. https://mhforce.com/wp-content/uploads/2026/05/Start_With_The_End_in_Mind.pdf
Morehouse Instrument Company. Probability of False Reject (PFR) (webinar). York, PA.
NASA-HDBK-8739.19-4. Estimation and Evaluation of Measurement Decision Risk. NASA Measurement Quality Assurance Handbook, Annex 4. National Aeronautics and Space Administration, Washington, DC, 2010.
NCSL International. Handbook for the Application of ANSI/NCSL Z540.3-2006 — Requirements for the Calibration of Measuring and Test Equipment. NCSL International, Boulder, CO, 2009.
Peart, N. "Freewill." Performed by Rush on Permanent Waves. Anthem Records, 1980.
Reese, P. and Harben, J. "Risk Mitigation Strategies for Compliance Testing." NCSLI Measure, Vol. 7, No. 1, 2012.
UKAS. LAB 48: Decision Rules and Statements of Conformity, Edition 5. United Kingdom Accreditation Service, Staines-upon-Thames, 2024.
About Morehouse
We believe in changing how people think about Force and Torque calibration in everything we do, including, "Where One Term Ends and the Next Begins, Part 7 of 7: PFA and PFR Explained: Probability of False Accept and Reject"
This includes setting expectations and challenging the "just calibrate it" mentality by educating our customers on what matters and what may cause significant errors.
We focus on reducing these errors and making our products simple and user-friendly.
This means your instruments will pass calibration more often and produce more precise measurements, giving you the confidence to focus on your business.
Companies around the globe rely on Morehouse for accuracy and speed.
Our measurement uncertainties are 10-50 times lower than the competition, providing you with more accuracy and precision in force measurement.
We turn around your equipment in 7-10 business days so you can return to work quickly and save money.
When you choose Morehouse, you're not just paying for a calibration service or a load cell.
You're investing in peace of mind, knowing your equipment is calibrated accurately and on time.
Through Great People, Great Leaders, and Great Equipment, we empower organizations to make Better Measurements that enhance quality, reduce risk, and drive innovation.
With over a century of experience, we're committed to raising industry standards, fostering collaboration, helping with understanding risk, and delivering exceptional calibration solutions that build a safer, more accurate future.
Contact Morehouse at info@mhforce.com to learn more about our calibration services and load cell products.
Email us if you ever want to chat or have questions about a blog.
We love talking about this stuff. We have many more topics other than, "Where One Term Ends and the Next Begins, Part 7 of 7: PFA and PFR Explained: Probability of False Accept and Reject"
Our YouTube channel has videos on various force and torque calibration topics here.