

The ASTM E74 Lower Limit Factor: What it is, What it is Not, and How to Use it in a Measurement Uncertainty Analysis
Many people in this business know their instruments, standards, and processes. The trouble starts when something new lands in the scope. A parameter shows up that nobody on staff has had to quantify before, the guidance for it is not easy to find, and last cycle's budget gets copied forward one more year while nobody goes back out to see what has been published since. Or one budget gets applied to every instrument at every point in the range, as if measurement uncertainty were one-size-fits-all. Did anyone go back and check what the standard says that number contains? Did anyone ask what it leaves out? Did anyone run the budget at any force other than capacity? There are excellent guidance documents available and recommended practices, though when you get into specific standards, such as ASTM E74 for force and ASTM E2428 for torque, there seems to be mass confusion, pun intended, and a shout-out to Heather Wade, the NCSLI Education and Training recipient of 2026. Count a contributor twice, and the budget looks honest while overstating the doubt. Leave one out, and the budget looks impressive while hiding risk. Both mistakes show up constantly in force budgets, and both tend to involve the same number: the ASTM E74 lower limit factor.
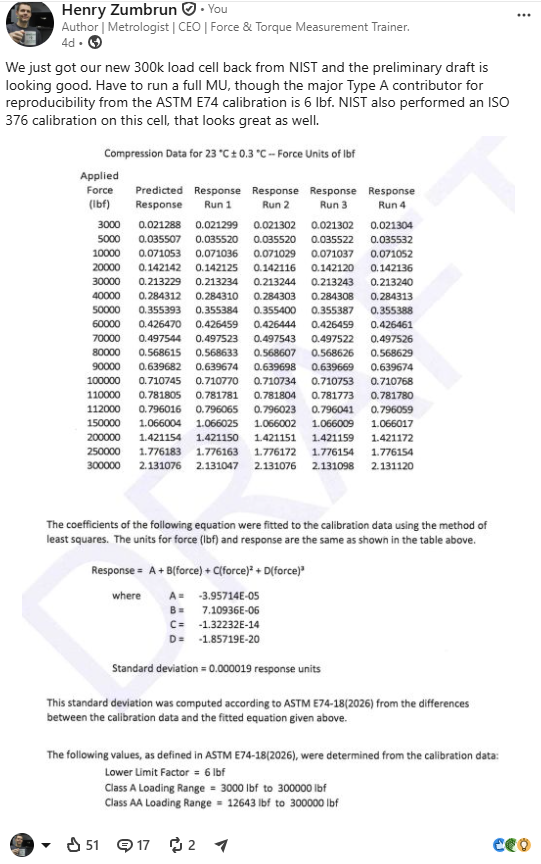
This article exists because our good friend Joseph Rindone asked two questions on LinkedIn; yes, someone actually reads our posts, though this is not about that notorious outlier. This is about writing something that deserves more than the length of a comment box or two. We had been discussing a NIST calibration of a Morehouse 300 000 lbf reference load cell paired with an HBM DMP40, which produced a lower limit factor of 6 lbf, or 0.002 % of full scale. Joseph pushed back on two points:
- Is the LLF really the Type A reproducibility uncertainty? Should we not go back to the underlying repeatability and reproducibility data and derive the appropriate standard uncertainty, rather than dropping 6 lbf into the budget as a standard uncertainty?
- How do you incorporate the LLF-related contribution into a measurement uncertainty budget alongside long-term instrument stability without double-counting contributors?
Both questions are the right questions. Both have answers in our e-book, though it is 400-plus pages and a lot to absorb. Let us give it a go in this article to try and explain the best way I know how, relying on what I learned throughout the years during those coffee breaks and lunches during the ASTM E74 meetings on what the LLF is and on measurement uncertainty, which I’ve learned over the years through many qualified and unqualified people 😊. I think all the bits below are from the qualified MU experts.
What the Lower Limit Factor is
ASTM E74 calibrates a continuous-reading force-measuring instrument by applying at least 30 force applications, of which at least 10 must be at different forces. The instrument is run at three rotational positions, 0°, 120°, and 240°, with its position shifted before any series of forces is repeated, so ten force levels at three positions is exactly how the 30-application minimum is met. For instruments that cannot be rotated 120°, such as some proving rings, force dynamometers, and Brinell hardness test calibrators, E74 permits positions of approximately 60° and 300° instead. A polynomial equation is fitted to the force and deflection values by the method of least squares. The standard deviation is the square root of the sum of the squared differences between each observed deflection and the value predicted by the calibration equation, divided by the number of observations minus the degree of fit minus one.
The lower limit factor (LLF) is 2.4 times that standard deviation, converted to force units using the average ratio of force to deflection. If the calculated value comes out below the instrument resolution, the LLF is set equal to the resolution. Specific force-measuring instruments, the class not amenable to a calibration equation, fall under different criteria that this article does not address. ASTM E74-18(2026) defines it as “a statistical estimate of the error in forces computed from the calibration equation of a force-measuring instrument when the instrument is calibrated in accordance with these practices.” Simple, right? It is, right up to the moment someone drops that number into an uncertainty budget and calls the work done.
Why 2.4? The note to section 8.5 of E74 answers it: “Of historical interest, the limit of 2.4 standard deviations was originally determined empirically from an analysis of a large number of force-measuring instrument calibrations and contains approximately 99 % of the residuals from least-squares fits of that sample of data.” It is a coverage factor, not a sacred constant, and yes, k = 2.4 is actually 98.4 %, though I’m quoting the standard here, which says 99 %. E74 hedges this itself in Note 6: the departures of the observed deflections from the calibration equation are not purely random, they arise partly from localized variation in the instrument readings, so the residuals may not follow the normal curve and the customary estimates based on the statistics of random variables may not be strictly applicable. Treat 2.4 as an empirical divisor that works, not as a theoretical k.
The LLF then sets the verified range of forces. Class AA requires the LLF not to exceed 0.05 % of force, which is where the multiplier of 2 000 times the LLF comes from; Class A allows 0.25 %, hence 400 times. E74 also recommends that the lower force limit not be set below 2 % of the instrument's capacity. Our 6 lbf LLF supports a Class AA verified range of forces down to 12 000 lbf on a 300 000 lbf standard. In earlier editions of E74, the LLF was simply called “uncertainty,” and that old name is the root of most of the confusion this article addresses.
Note: The best explanation I ever heard, and the one I now teach, is this: the LLF is the expected performance of the device when it is used under conditions similar to its calibration. Similar means the fixturing, plumb, level, square, rigidity, and torsion characteristics of the loading frame all match. They never fully do. And stability is not in it at all; that number belongs in your budget, but it is not part of what the LLF is.
What the LLF Contains, and What it Leaves Out
The LLF captures two things: the reproducibility of the instrument as it is repositioned and rotated in the calibration machine, and the deviation of the observed data from the interpolation equation (curve-fit error). Anything else that varied during the runs, such as localized imperfections in the indicating system or minor temperature fluctuation in the laboratory, is absorbed into that scatter rather than counted separately. Nothing beyond what happened during the calibration is in it.
EURAMET cg-4, the European guide on uncertainty of force measurements, describes the E74 method precisely: the calculation “only includes contributions due to reproducibility and deviation from the interpolation equation,” and it warns that “the use of only the calculated uncertainty value associated with the calibration when developing an uncertainty budget for the subsequent use of the force-measuring instrument should be avoided – the contributions due to the other uncertainty components present during the calibration should also be included.”
So, what does the LLF leave out? Start with the uncertainty of the applied calibration force, because that one is not obvious. The E74 standard deviation is computed from the residuals of observed deflection against the least-squares fit, and in that fit the applied force is taken as true. The random part of the calibrating machine's behavior does show up in the residuals, which is why the LLF grows at every tier down the traceability chain, but the systematic part, the number the certificate reports as uncertainty of applied force, does not. It enters the budget on its own line. ISO 376 takes the other approach and folds the applied calibration force into its combined uncertainty, which is why a budget built on an ISO 376 calibration carries that line as zero. E74 does not work that way.
The LLF also leaves out the repeatability and reproducibility of the instrument in the machine where you actually use it, compared against another load cell. The rotational data behind the LLF came from one machine, one short window, one operator per rotation, at the calibrating laboratory. It sets the expected performance of that load cell in a machine or situation with similar characteristics: plumb, level, square, rigid, and low in torsion. Your own process variation is yours to measure.
And then the rest: the stability of the instrument over time. Temperature effects in use. Misalignment in the user's machine. Adapter and fixturing differences. The resolution of a different indicator. Every one of these belongs in the budget as its own line, and none of them is inside the 6 lbf.
ASTM E74 says the same thing in its own words: the LLF “is one component of the measurement uncertainty. Other uncertainty components should be included in a comprehensive measurement uncertainty analysis.” The standard also draws the line of responsibility clearly. The calibration laboratory calibrates the instrument in accordance with the practices; the user determines the measurement uncertainty of the instrument in service.
Type A, Yes. Plug-and-Play, No.
Now to Joseph's first question. Is the LLF the Type A reproducibility uncertainty?
It is a Type A evaluation. The GUM defines Type A as an evaluation of uncertainty by the statistical analysis of a series of observations, and that is exactly what the LLF is: a pooled standard deviation computed from 30 or more observations against a fitted curve. The appendix of ASTM E74 lists it as a Type A contribution with a normal distribution, and A2LA G126, the guidance document on uncertainty budgets for force measuring devices, does the same.
The LLF is reported at 2.4 standard deviations. Before it enters the budget, it must be reduced to one standard deviation: 6.00 lbf / 2.4 = 2.50 lbf. G126 is explicit on this point, and it notes the practical problem that many calibration reports list only the LLF and not the standard deviation. If the report lists the standard deviation per section 8 of E74, use it as reported. If it lists only the LLF, divide by 2.4.
The degrees of freedom come from the calibration itself: the number of observations minus the degree of the polynomial minus one. For a 36-point calibration (3 runs of data and 12 points) fitted with a second-degree polynomial, that is 36 − 2 − 1 = 33. Those degrees of freedom feed the Welch-Satterthwaite equation when the effective coverage factor is calculated.
Joseph is also right on a second point, and it is worth stating plainly: the LLF is a property of the unit under test and the calibration process, not of the NIST machine. The reproducibility of the NIST deadweight machine is already accounted for inside NIST's reported uncertainty of applied force. On this calibration, NIST reported 3 lbf at 300 000 lbf (k = 2), which is a standard uncertainty of 1.5 lbf, exactly the 0.0005 % figure Joseph calculated. That contribution enters the budget as its own line: reference standard uncertainty. It does not replace the LLF, and the LLF does not replace it.
Notice what that comparison tells you. The applied-force standard uncertainty is 1.5 lbf. The LLF standard deviation is 2.5 lbf. The scatter of this instrument against its own curve, under the best conditions on Earth, is larger than the doubt in the forces applied to it. E74 permits an LLF smaller than the reference standard uncertainty, which ISO 376 does not; that is a known criticism of the standard and one more reason the LLF alone is not a measurement uncertainty.
And the underlying repeatability and reproducibility data Joseph asked about? They still belong in the budget, separately. The LLF captures the reproducibility of the instrument in one machine, over one short window, with one operator per rotation. It does not capture technician-to-technician variation in your laboratory or the repeatability of your own measurement process. Those come from a repeatability and reproducibility study and enter as their own Type A lines.
Building the Budget: The Force Recipe
For a force-measuring instrument calibrated in accordance with ASTM E74 and used to calibrate other instruments, A2LA G126 and the appendix of E74 converge on the same set of contributors, though not on the same labels. Appendix X1 of E74 treats the uncertainty of the applied calibration force as a Type A contribution with a normal probability function; G126 and the tables below carry it as Type B, divided by its reported coverage factor. The classification changes nothing in the arithmetic but say which convention you followed so a reviewer is not left guessing.
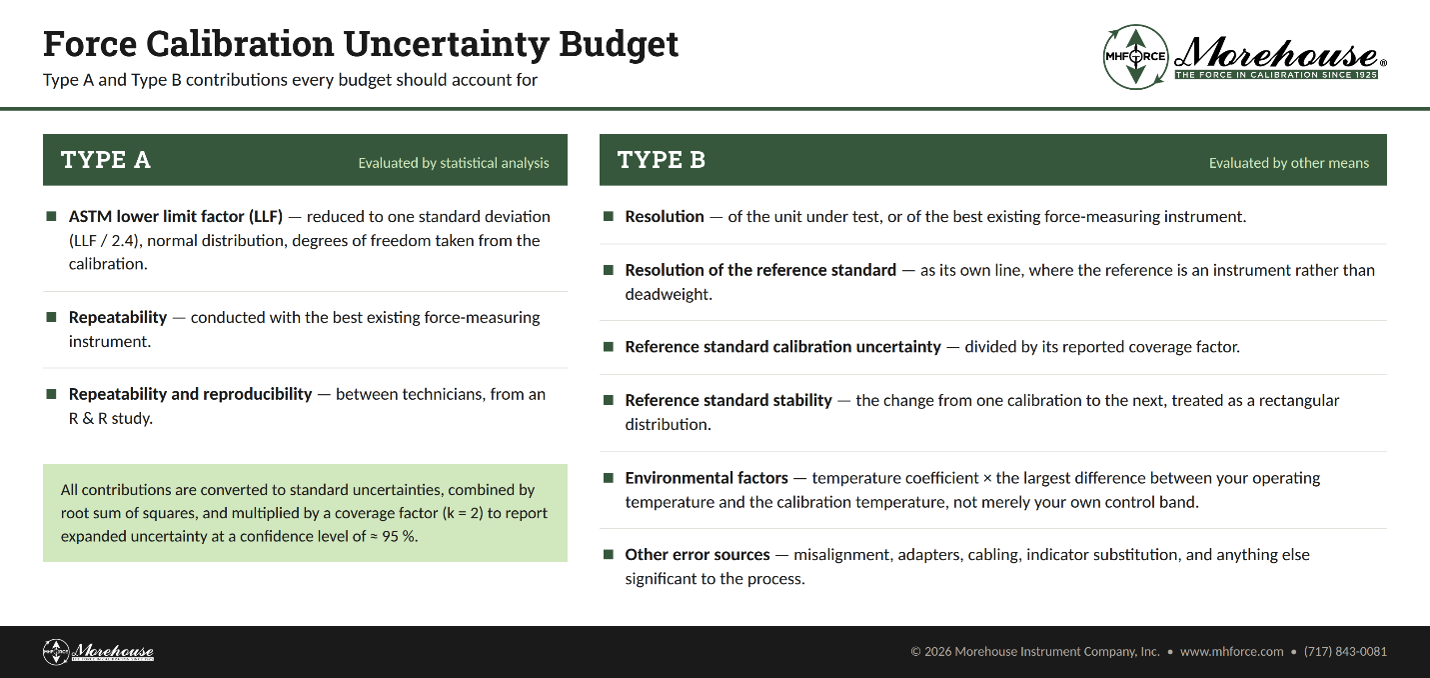
Type A contributions
- ASTM LLF reduced to one standard deviation (LLF / 2.4), normal distribution, degrees of freedom from the calibration.
- Repeatability conducted with the best existing force-measuring instrument.
- Repeatability and reproducibility between technicians, from an R & R study.
Type B contributions
- Resolution of the unit under test, or of the best existing force-measuring instrument.
- Resolution of the reference standard, as its own line, where the reference is an instrument rather than deadweight.
- Reference standard calibration uncertainty, divided by its reported coverage factor.
- Reference standard stability, the change from one calibration to the next, treated as rectangular.
- Environmental factors: the temperature coefficient multiplied by the largest difference between your operating temperature and the temperature at which the instrument was calibrated, not merely your own control band.
- Other error sources: misalignment, adapters, cabling, indicator substitution, and anything else significant to the process.
Combine everything by root sum of squares, calculate effective degrees of freedom with the Welch-Satterthwaite equation, and apply the coverage factor for approximately 95 % confidence.
One requirement gets ignored so often that it deserves its own paragraph. The uncertainty analysis must be conducted at several test points throughout the loading range, not at capacity only. Most budgets we review use capacity alone. That is wrong. The LLF is constant in force units, so its percentage contribution grows as the applied force shrinks, and a budget that looks fine at 100 % of range can be dominated by an entirely different contributor at 10 %. G126 states it directly: any uncertainty analysis should be conducted on several test points used throughout the loading range. What if you ran the same budget at 10 % of range? What if the line that looked negligible at capacity turned out to run the whole show? The worked example below does exactly that, on real numbers.
A Worked Example: The 300 000 lbf Reference Cell
Here is the complete budget for the instrument that started this conversation. The load cell is a Morehouse 300 000 lbf cell paired with an HBM DMP40. The calibration is by NIST deadweight primary standards. The inputs:
- ASTM E74 LLF: 6.00 lbf, from a 35-point calibration with a second-degree fit (32 degrees of freedom).
- Reference standard uncertainty: 3 lbf at 300 000 lbf, k = 2, so 1.5 lbf standard uncertainty (0.0005 %), scaling with applied force.
- Reference standard stability: 0.005 % of reading over a one-year interval, from calibration history on Morehouse Ultra-Precision cells, treated as rectangular. That is the good end of the 0.005 % to 0.03 % band we see on these cells above roughly 20 % of rated output. Below 20 %, take the number from your own history at that force rather than extrapolating this one, because a small absolute change in output moves the percentage a long way at low force.
- Resolution: the DMP40 resolves 0.000001 mV/V on a 2 mV/V output, which is 300 000 / 2.000000 × 0.000001 = 0.15 lbf. This is why pairing the cell with the DMP40 matters; the resolution line all but disappears.
- Environmental factors: 0.0015 % of reading per °C with the laboratory controlled to ±1 °C.
- Other error sources: side-load sensitivity of 0.05 % per inch with a maximum eccentricity of 1/16 inch, giving 0.003 % of applied force.
- Repeatability and R & R values from an in-house study with two technicians (example values, scaling with force).
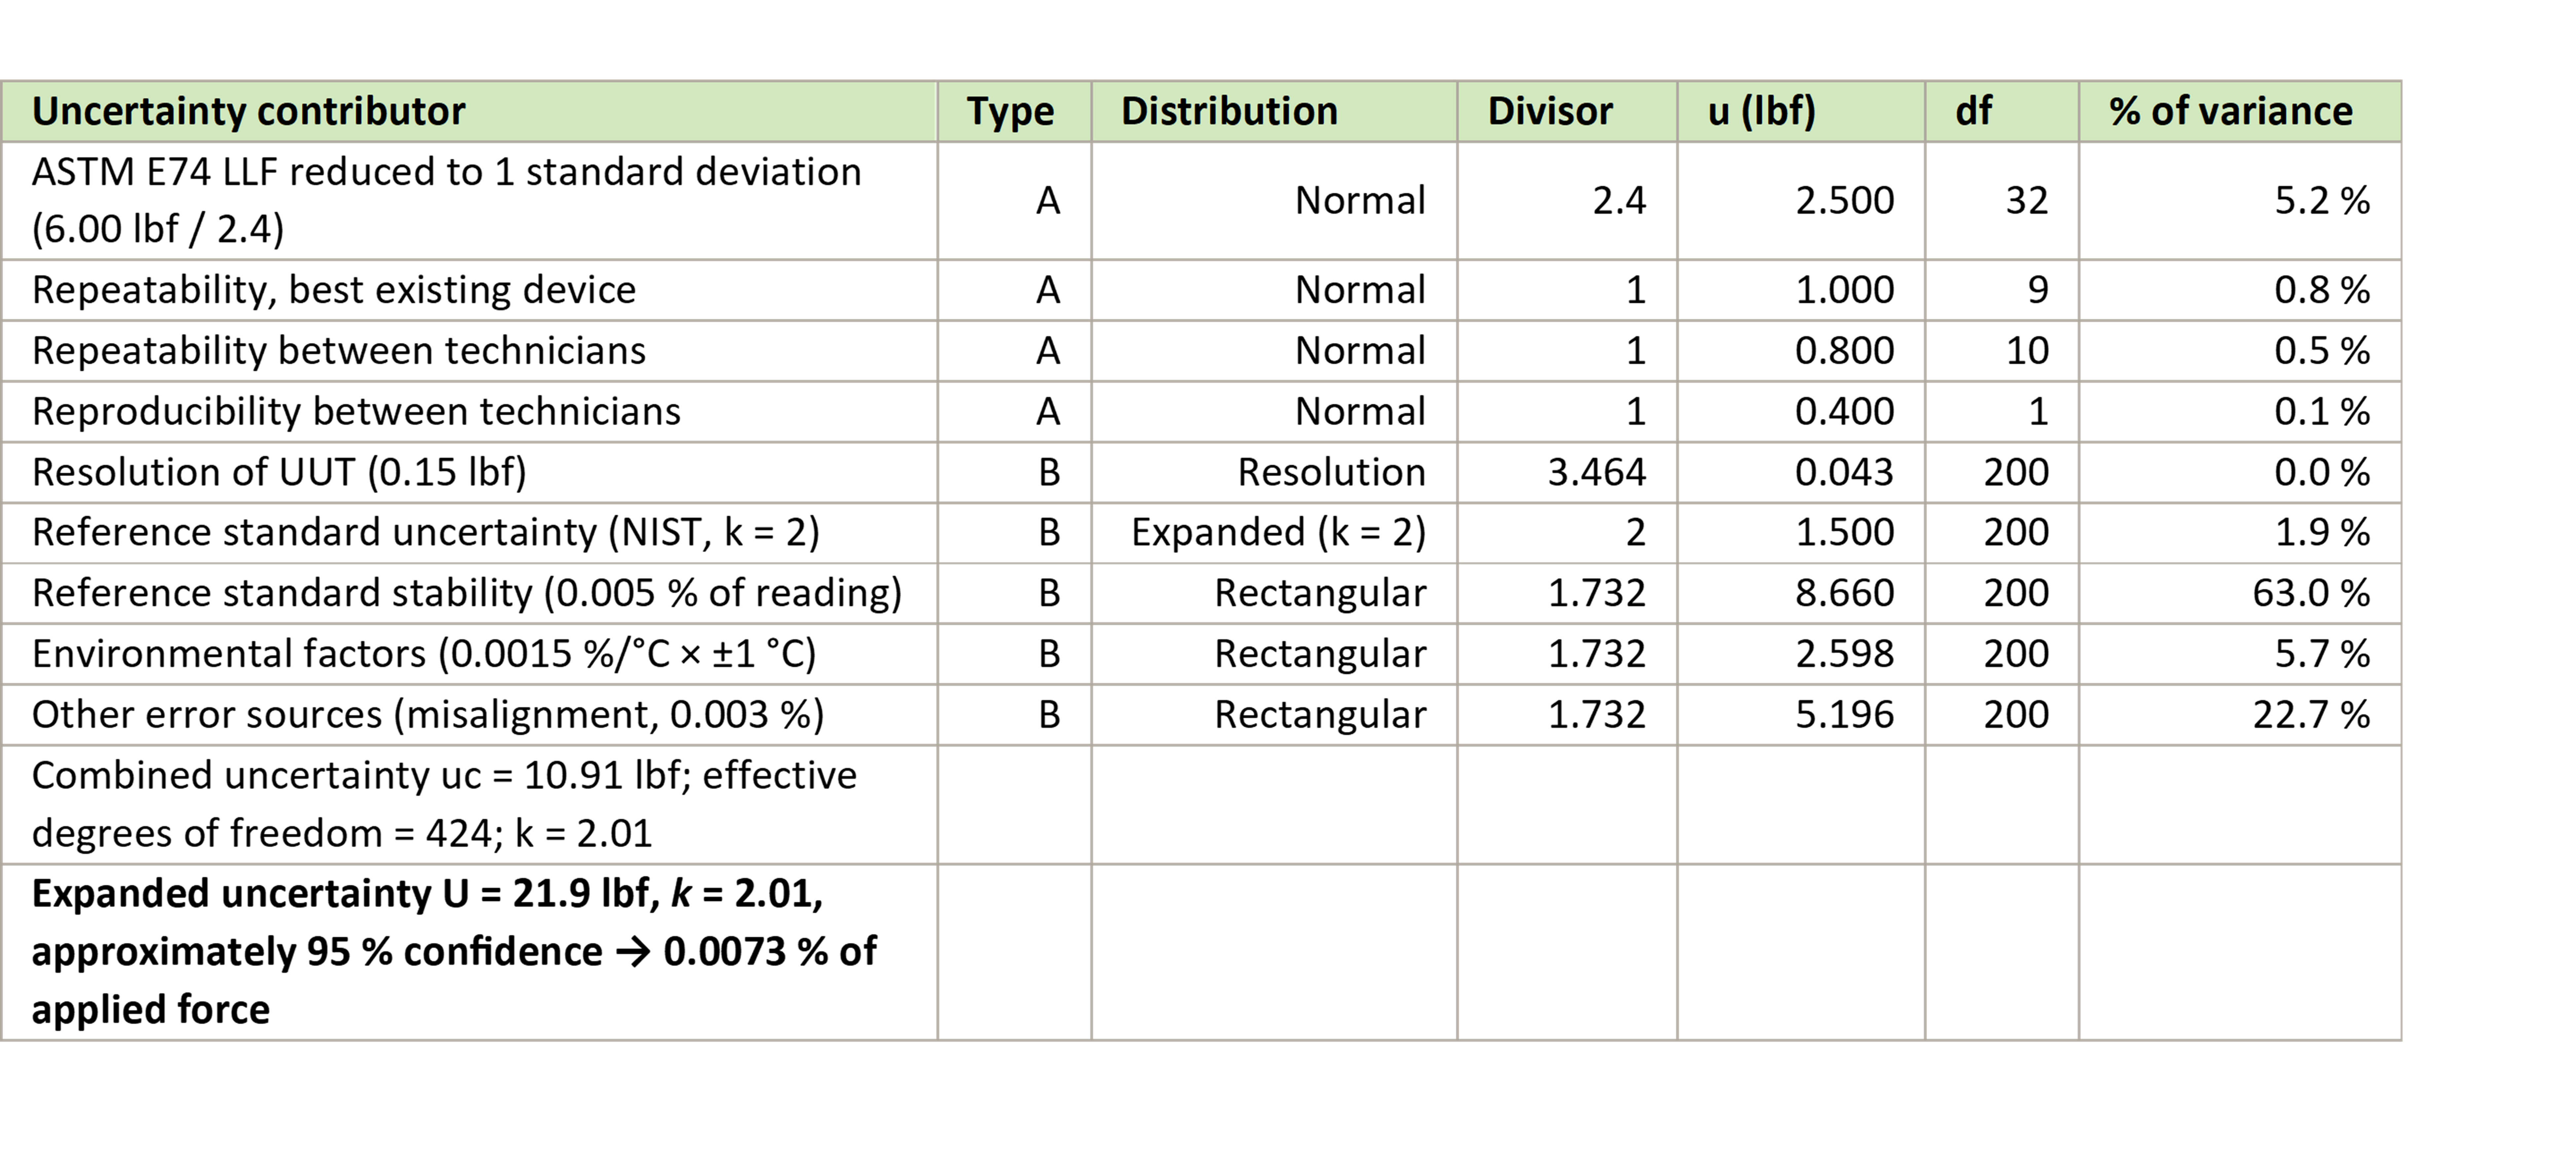 Table 1: Uncertainty budget at 300 000 lbf (100 % of range). Reference standard stability dominates at 63.0 % of the variance; the LLF contributes 5.2 %. The LLF row is entered here as 6.00 lbf with a divisor of 2.4. Entering the standard deviation converted to force units with a divisor of 1 gives the identical 2.500 lbf, because that standard deviation and LLF / 2.4 are the same quantity. Either layout is correct as long as the divisor matches the magnitude.
At capacity, the story is stability. The 0.005 % one-year stability term contributes 63.0 % of the variance, and the LLF just 5.2 %. Now run the same budget at 30 000 lbf, 10 % of capacity and well inside the Class AA verified range of forces.
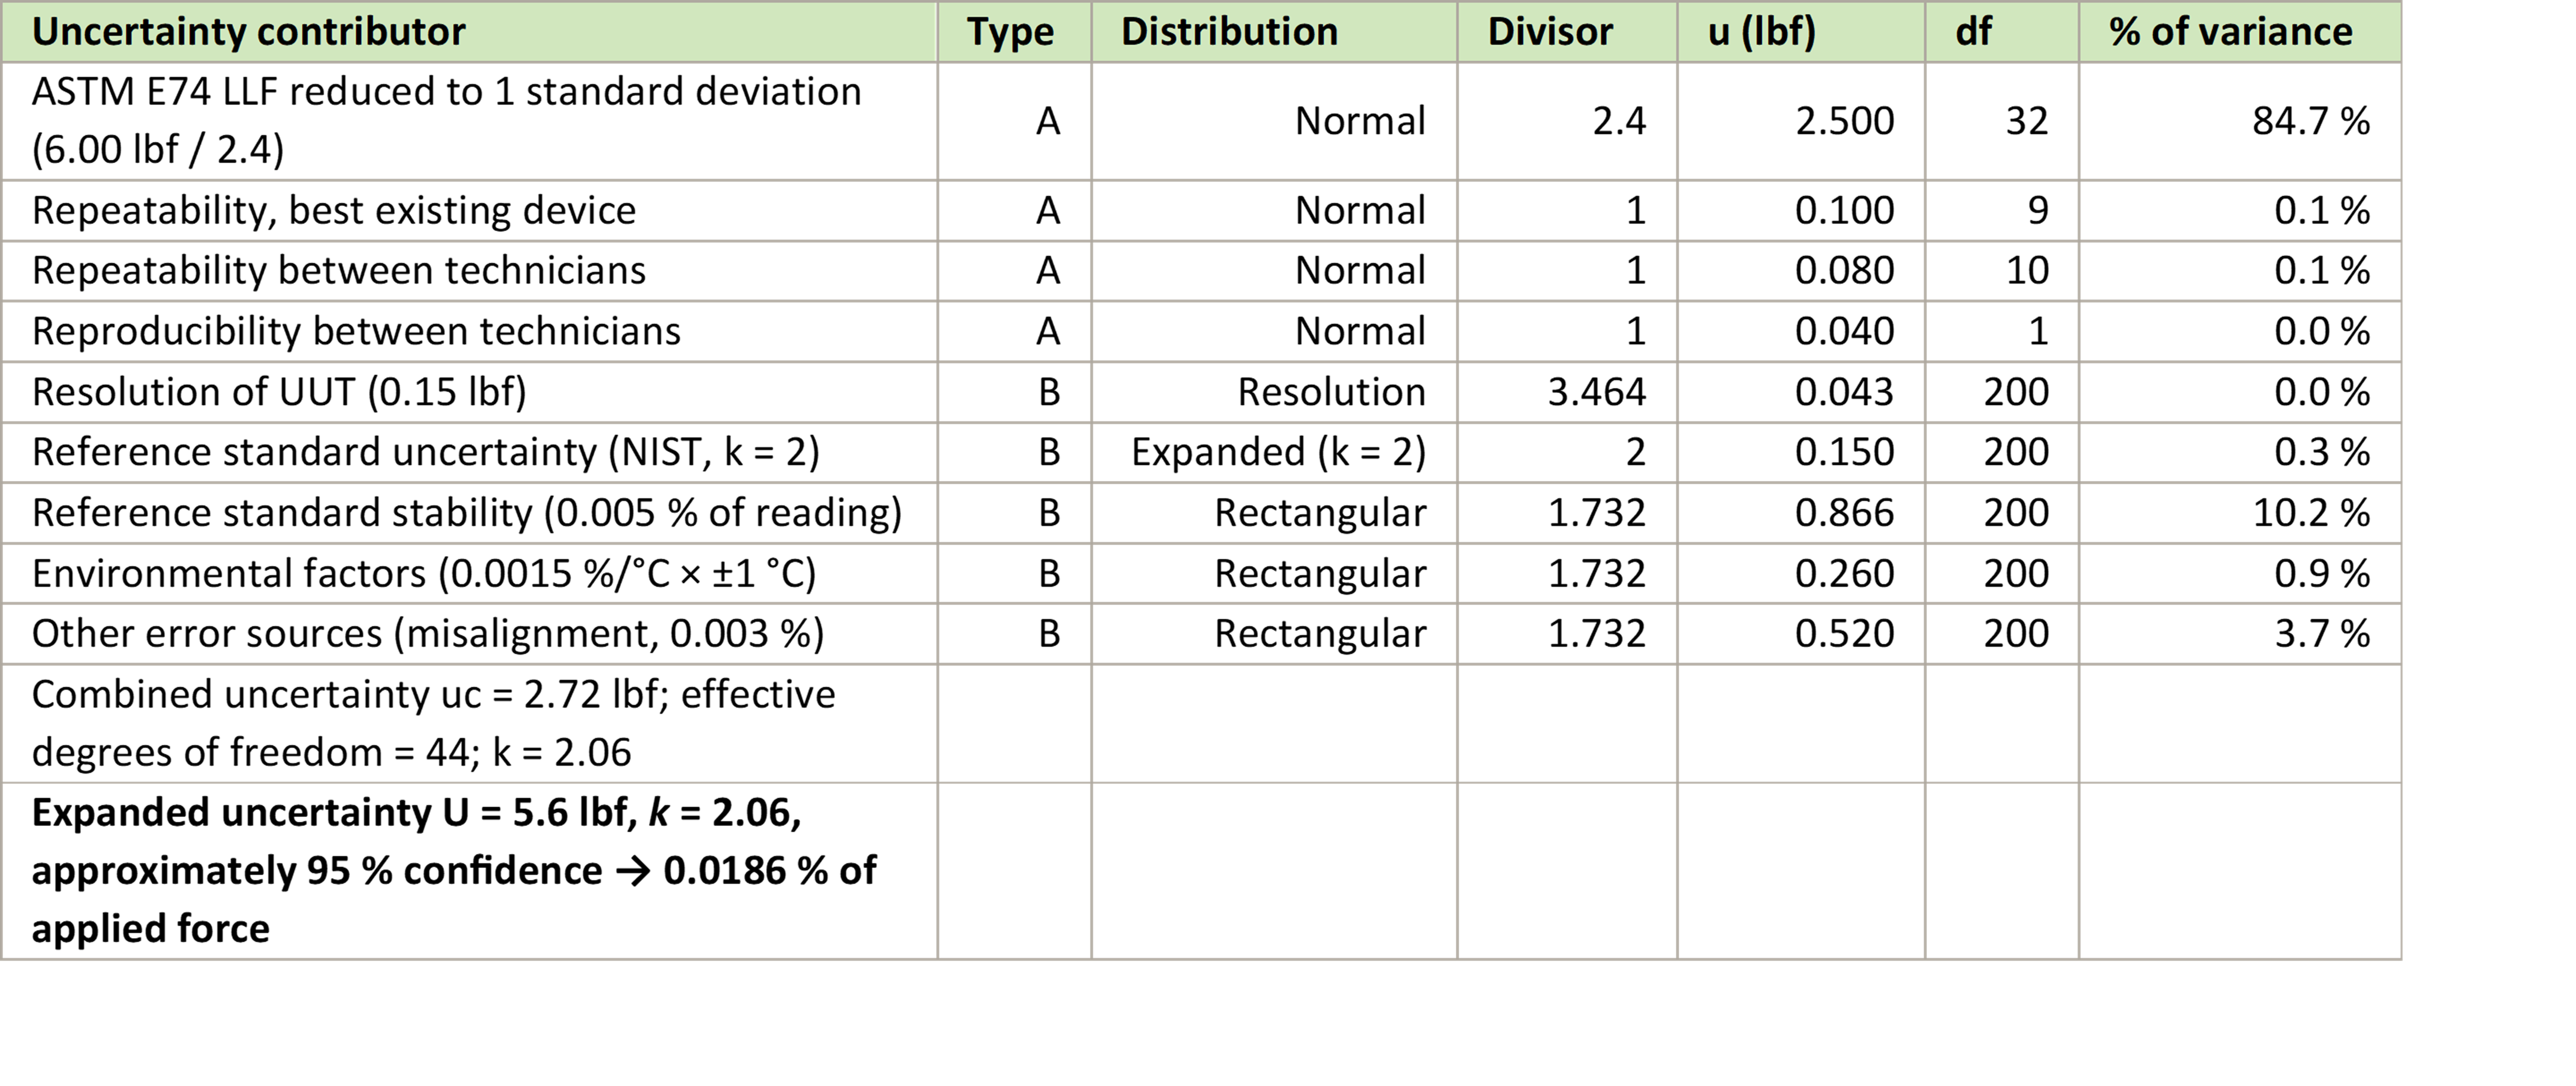
Table 2: The same budget at 30 000 lbf (10 % of range). The LLF, constant at 2.50 lbf standard uncertainty, now contributes 84.7 % of the variance.
Same instrument. Same calibration. Same contributors. At 10 % of range the LLF contributes 84.7 % of the variance and the budget nearly triples as a percentage of applied force. If we had published the capacity budget alone, we would have claimed 0.0073 % everywhere while the truth at 30 000 lbf is 0.0186 %.
This is what “evaluate at several points throughout the loading range” looks like in practice:
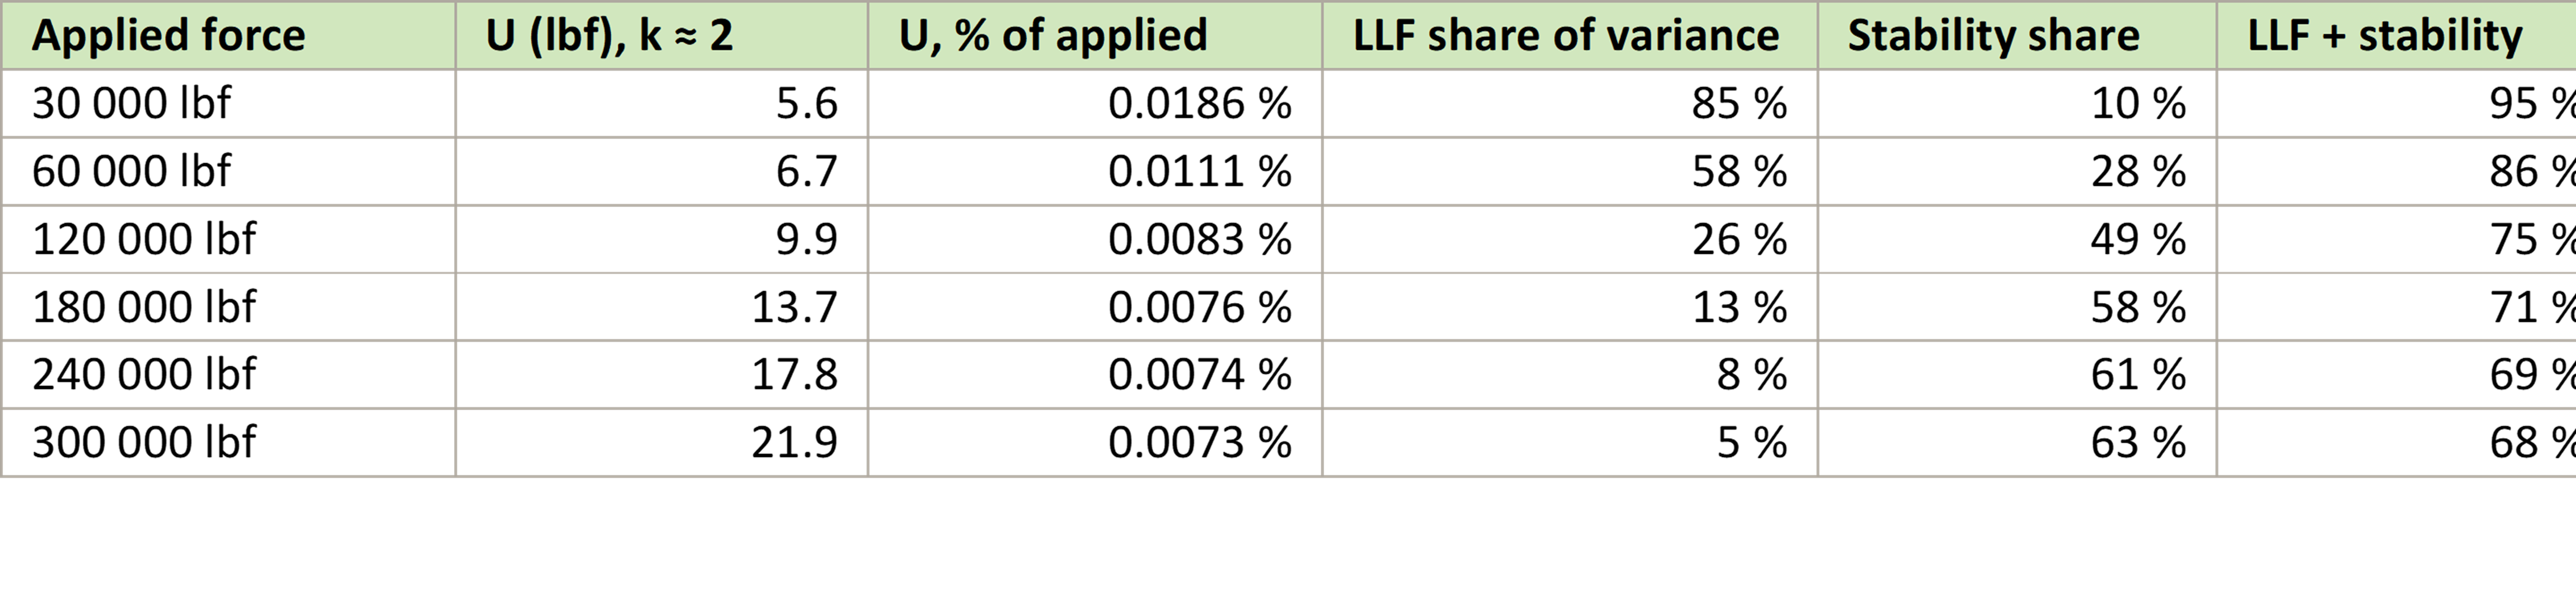 Table 3: Expanded uncertainty (approximately 95 % confidence) across the loading range. The LLF and reference standard stability together account for 68 % to 95 % of the variance at every point.
Look at the last column. At every single point in the range, the LLF and instrument stability together account for 68 % to 95 % of the budget. This is why we keep saying the LLF and stability are the dominant contributors in most force uncertainty budgets: not as a slogan, but as arithmetic.
Answering the Second Question: How to Avoid Double-Counting
Joseph's second question is the one that separates a defensible budget from a padded one. If the LLF already contains reproducibility and curve-fit error, what else in the budget overlaps it? Here are the rules we apply, each with its reason.
- The LLF replaces non-linearity, hysteresis, and static error band. Never add both.
A2LA G126 states this outright: if calibrating to ASTM E74 or ISO 376, contributions from non-linearity, static error band, or hysteresis should not be considered for the uncertainty budget. For E74 calibrations those contributors are replaced by the LLF. The curve fit already characterizes the deviation of the instrument from its equation; adding a specification-sheet non-linearity on top counts the same physics twice. Specification-sheet terms are for commercial calibrations that were never tested for expected performance.
- Stability is not double-counting. It is a different axis: time.
This is the direct answer to Joseph. The LLF is a snapshot: it measures scatter within one calibration, over a few days, in one machine. Stability measures the change in output between calibrations, over a year or two. There is no overlap between within-calibration scatter and year-over-year drift, so both belong in the budget, and each carries its own line. The one caution runs the other way: derive stability from your calibration history (the change in deflection at the same force between successive calibrations), not from a specification sheet, and do not add a separate “drift” line from the specification sheet on top of a history-based stability line. Pick one source for the time axis.
ASTM E74 supports the interval side of this: instruments must demonstrate changes of less than 0.032 % of reading over the Class AA verified range (0.16 % for Class A) to support a two-year interval. If your stability term is larger than that, the budget is telling you something the calibration sticker cannot.
- Misalignment inside the calibration is already in the LLF. Misalignment in use is not.
The rotations at 0°, 120°, and 240° exist to sample the effect of repositioning and imperfect loading. The E74 appendix says the misalignment uncertainty of the calibration process “cannot be separated from errors determined in the rotational tests and is not evaluated separately.” So do not add a misalignment line for the calibrating machine. Do add one for your machine if it is not as plumb, level, square, and rigid as the machine that calibrated the instrument, or if your adapters differ from the ones used at calibration. In our example the 0.003 % line covers side loading in the user's frame, not NIST's deadweight machine.
- Watch the resolution floor.
E74 sets the LLF equal to the resolution when the calculated value is lower. When that happens, the resolution is already the LLF, and listing UUT resolution again as a separate Type B line counts it twice for the same indicator. When the LLF is well above resolution, as with the DMP40 here (2.50 lbf against 0.15 lbf), the separate resolution line is correct and nearly free. Some laboratories carry the resolution twice deliberately as a conservative choice; that is defensible, but it should be a documented decision, not an accident.
- System calibration means the indicator is inside the curve.
If the load cell and indicator were calibrated together as a system, the indicator's linearity and calibration uncertainty are absorbed into the calibration equation and the LLF. The E74 appendix warns these factors “should not be double counted.” Add a separate electrical measurement uncertainty line only when the calibration was reported in mV/V on the laboratory's instrumentation, or when you substitute an indicator after calibration, in which case E74 section 12 governs and the substituted indicator needs its own uncertainty, verified at one third of the system uncertainty or better.
- The same logic runs through other disciplines.
This architecture is not unique to force. ISO 376 Annex C computes a combined uncertainty that already includes the applied calibration force, so a budget built on an ISO 376 calibration enters the reference standard uncertainty as zero on its own line; G126's Table 4 shows exactly that. EURAMET cg-18 does the same for weighing instruments: the uncertainty of a weighing result in use starts from the calibration certificate value and then adds drift and environmental terms that the certificate could not contain. Calibration uncertainty and in-use uncertainty are different quantities everywhere, and the budget must say which one it is stating.
- A measured comparison replaces the side-load line. Never carry both.
The strongest way to quantify what your load frame does to a measurement is to compare two secondary standards, each calibrated by primary standards, against each other in your machine. E74 Appendix X1.5.1.3 points at the same method for accounting for differences in the load frame and measurement system. That comparison error already contains side-load sensitivity, alignment, adapter effects, and the dissemination of calibration values, so if you carry it, drop the separate side-load line. If you do not run the comparison, carry side load explicitly from the specification sheet. Carrying both counts the same physics twice, and it is the most common way a budget built on good data still comes out padded.
What this Means Up and Down the Traceability Chain
Step back from any single certificate and look at what the chain does. A very good load cell used as a reference standard, paired with a good meter, the correct adapters, and a machine that is plumb, level, square, and rigid, will typically sit around 0.02 % of applied force at 20 % of its range; the ranges we see across load cell and indicator classes are laid out in Force Calibration for Technicians and Quality Managers. Calibrate that same reference one tier down, against a secondary standard rather than deadweight primary standards, and the budget grows at every step. The LLF grows at every tier, because the reference standard's uncertainty band widens the scatter the curve fit has to absorb. Think of a photocopy of a photocopy. Each generation keeps every flaw the one above it had and adds a little of its own. Nothing in the chain ever hands the noise back.
That is the practical consequence of everything above. The LLF is not just a statistic on a certificate; it inherits the quality of the standards above it. Want a smaller LLF and a lower verified range of forces? Calibrate with deadweight primary standards, pair the cell with an indicator that removes resolution from the problem, and control the conditions that feed reproducibility.
Joseph connected this exchange to our “pick two of three” article: price, quality, and lead time, and a laboratory must decide which two it will not compromise. Morehouse picks quality and lead time. A 6 lbf LLF on a 300 000 lbf standard is what quality looks like when it stops being a marketing word and becomes measurable performance: 0.002 % of full scale, a Class AA verified range of forces starting at 12 000 lbf, and a budget where every contributor is counted once, on purpose.
Conclusion
The lower limit factor is a Type A estimate of an instrument's expected performance under the conditions of its calibration: reproducibility plus curve-fit deviation, at 2.4 standard deviations, in force units. Used correctly, it enters a measurement uncertainty budget divided by 2.4, with degrees of freedom from the calibration, alongside the reference standard uncertainty, stability, resolution, environment, and process R & R. Used incorrectly, it gets pasted in whole, stacked on top of specification-sheet terms it already contains, or evaluated at capacity only.
The habits that keep a budget honest are simple. Divide the LLF by 2.4, or better, ask your laboratory for the standard deviation. Enter the reference standard uncertainty as its own line. Take stability from your own calibration history. Evaluate the budget at several points throughout the loading range. And for every line, be able to say what physical effect it represents and why no other line contains it.
If you want to go deeper, read section 8 and Appendix X1 of ASTM E74, section 6 of EURAMET cg-4, and A2LA G126. Then open your own budget and check every line against the question Feynman would ask: am I fooling myself? My thanks to Joseph Rindone for asking the questions that prompted this article; the metrology community is better for people who push past the easy answer.
References
- ASTM E74, Standard Practices for Calibration and Verification for Force-Measuring Instruments, ASTM International.
- A2LA G126, Guidance on Uncertainty Budgets for Force Measuring Devices, August 2024.
- EURAMET cg-4, Uncertainty of Force Measurements, Version 2.0.
- EURAMET cg-18, Guidelines on the Calibration of Non-Automatic Weighing Instruments, Version 4.0, 2015.
- JCGM 100:2008, Evaluation of Measurement Data: Guide to the Expression of Uncertainty in Measurement.
- ILAC P14:09/2020, ILAC Policy for Uncertainty in Calibration.
- Zumbrun, H., Force Calibration for Technicians and Quality Managers, Morehouse Instrument Company, 2026.
- ISO 376, Metallic Materials: Calibration of Force-Proving Instruments Used for the Verification of Uniaxial Testing Machines.
About Morehouse
We believe in changing how people think about Force and Torque calibration in everything we do, including, "The ASTM E74 Lower Limit Factor"
This includes setting expectations and challenging the "just calibrate it" mentality by educating our customers on what matters and what may cause significant errors.
We focus on reducing these errors and making our products simple and user-friendly.
This means your instruments will pass calibration more often and produce more precise measurements, giving you the confidence to focus on your business.
Companies around the globe rely on Morehouse for accuracy and speed.
Our measurement uncertainties are 10-50 times lower than the competition, providing you with more accuracy and precision in force measurement.
We turn around your equipment in 7-10 business days so you can return to work quickly and save money.
When you choose Morehouse, you're not just paying for a calibration service or a load cell.
You're investing in peace of mind, knowing your equipment is calibrated accurately and on time.
Through Great People, Great Leaders, and Great Equipment, we empower organizations to make Better Measurements that enhance quality, reduce risk, and drive innovation.
With over a century of experience, we're committed to raising industry standards, fostering collaboration, helping with understanding risk, and delivering exceptional calibration solutions that build a safer, more accurate future.
Contact Morehouse at info@mhforce.com to learn more about our calibration services and load cell products.
Email us if you ever want to chat or have questions about a blog.
We love talking about this stuff. We have many more topics other than, "The ASTM E74 Lower Limit Factor"
Our YouTube channel has videos on various force and torque calibration topics here.